Day 67

Market Recap
Both SPY and QQQ were mostly flat last week.
- SPY: +.53%
- QQQ: +.59%
Year-over-year:
- SPY: +12.38%
- QQQ: +14.77%
Trading Update: May 27 – May 30, 2025
Here is a summary of all trades made during the week (details listed below).
- Unrealized Profit/Loss: +$234
- Realized Profit/Loss: -$29
- Buying Power Used: $5.9K
- Buying Power Remaining: $1.9K

Last Week, I wrote:
For earnings, I expect to be able to find stocks with high IV, and I would look to outright Sell Cash Secured Put maybe a couple of months out. Then when IV crush hits post earnings, I expect to close out the trade at ~50% of original premium.
I did NOT do that!
Well, I partially did that. NVDA had a good IV going into earnings so I picked that as my play.
But I did not have enough capital to do a Cash Secured Put, so I ended up taking the less probability of profit path - and promptly got burned.
I opened an NVDA Straddle a day before its earnings. I speculated on a big move either up or down. But the bet would eventually make me poorer by $138.
There's something particularly cruel about being right for exactly the wrong amount of time.
My NVDA Straddle thesis played out perfectly in the after-hours - the stock moved, volatility spiked, profit materialized on my screen like a mirage.
For those few hours, I was a trading genius who'd cracked the earnings code.
Then the sun rose, regular trading began, and the market collectively shrugged at NVIDIA's results.
I closed the position and cut my loss at $138.
Portfolio Status
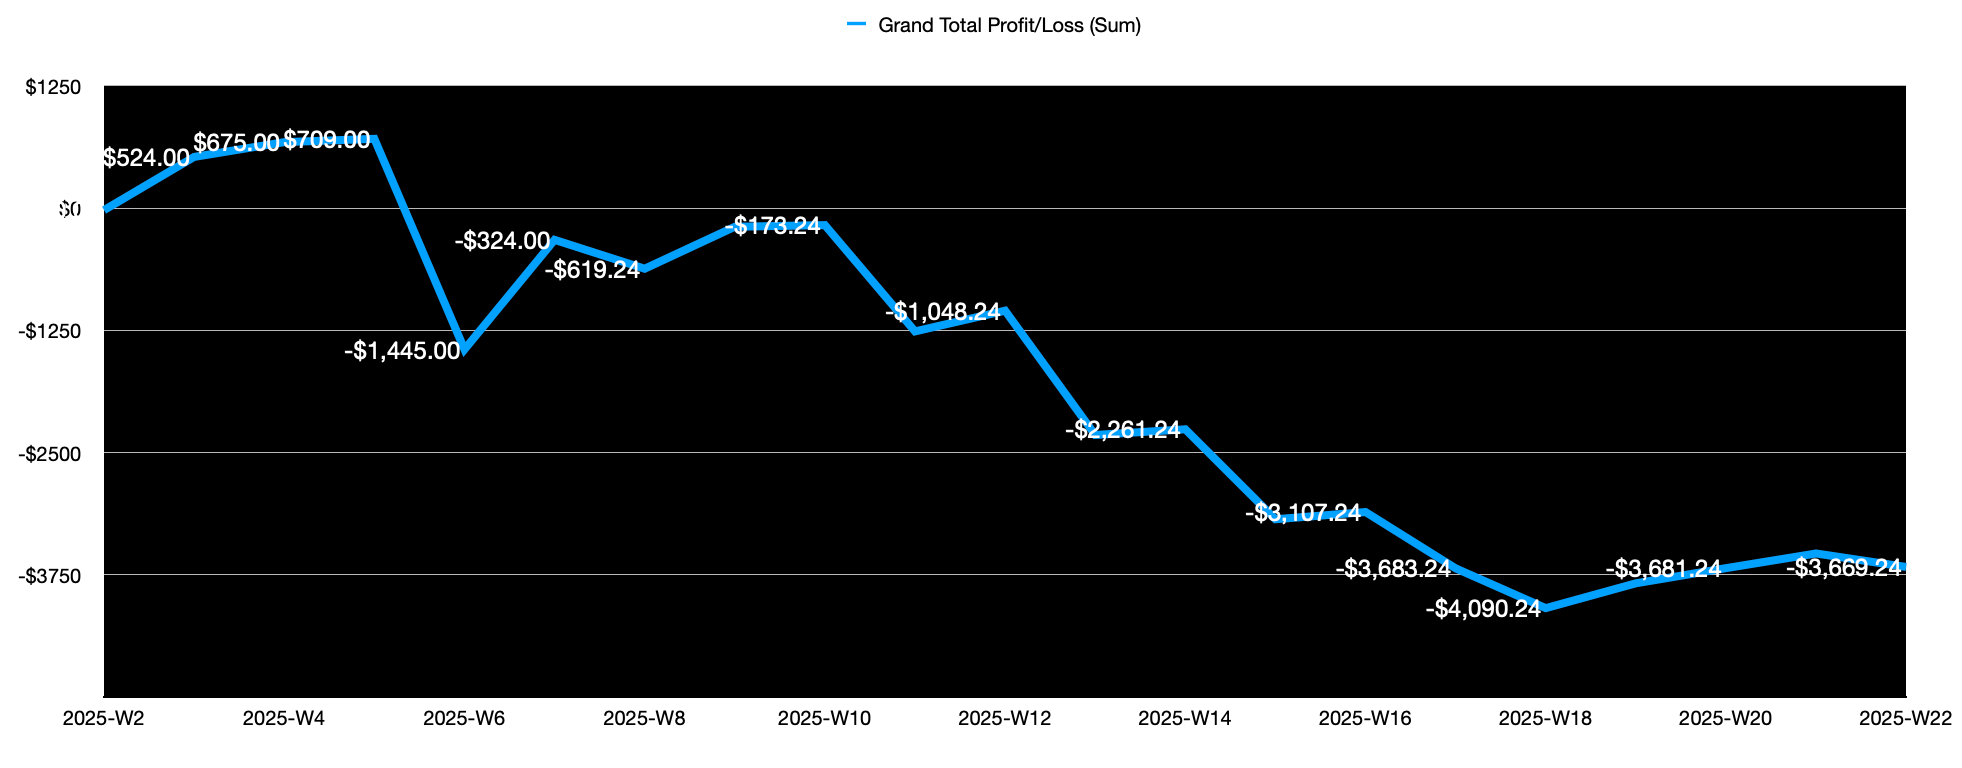
- 2025 Net P&L: Down $3.67K
- All Time: Down $6.57K

Profit and Loss Trend - Weekly
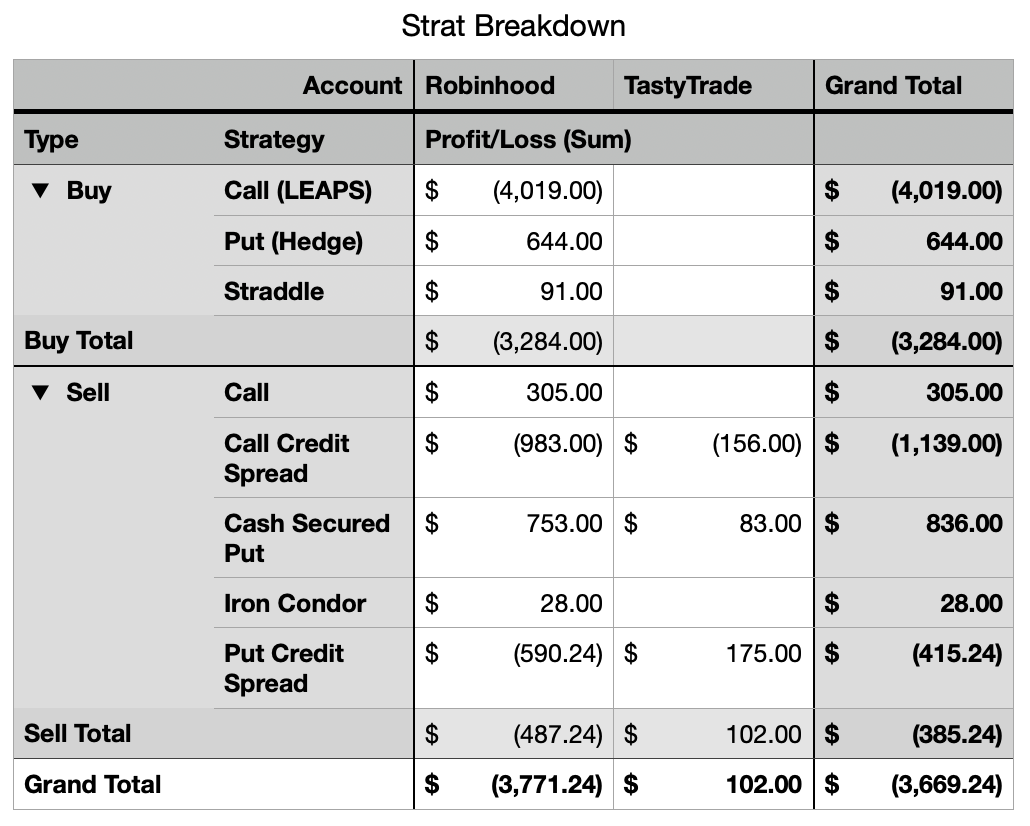
Portfolio Strategy Breakdown
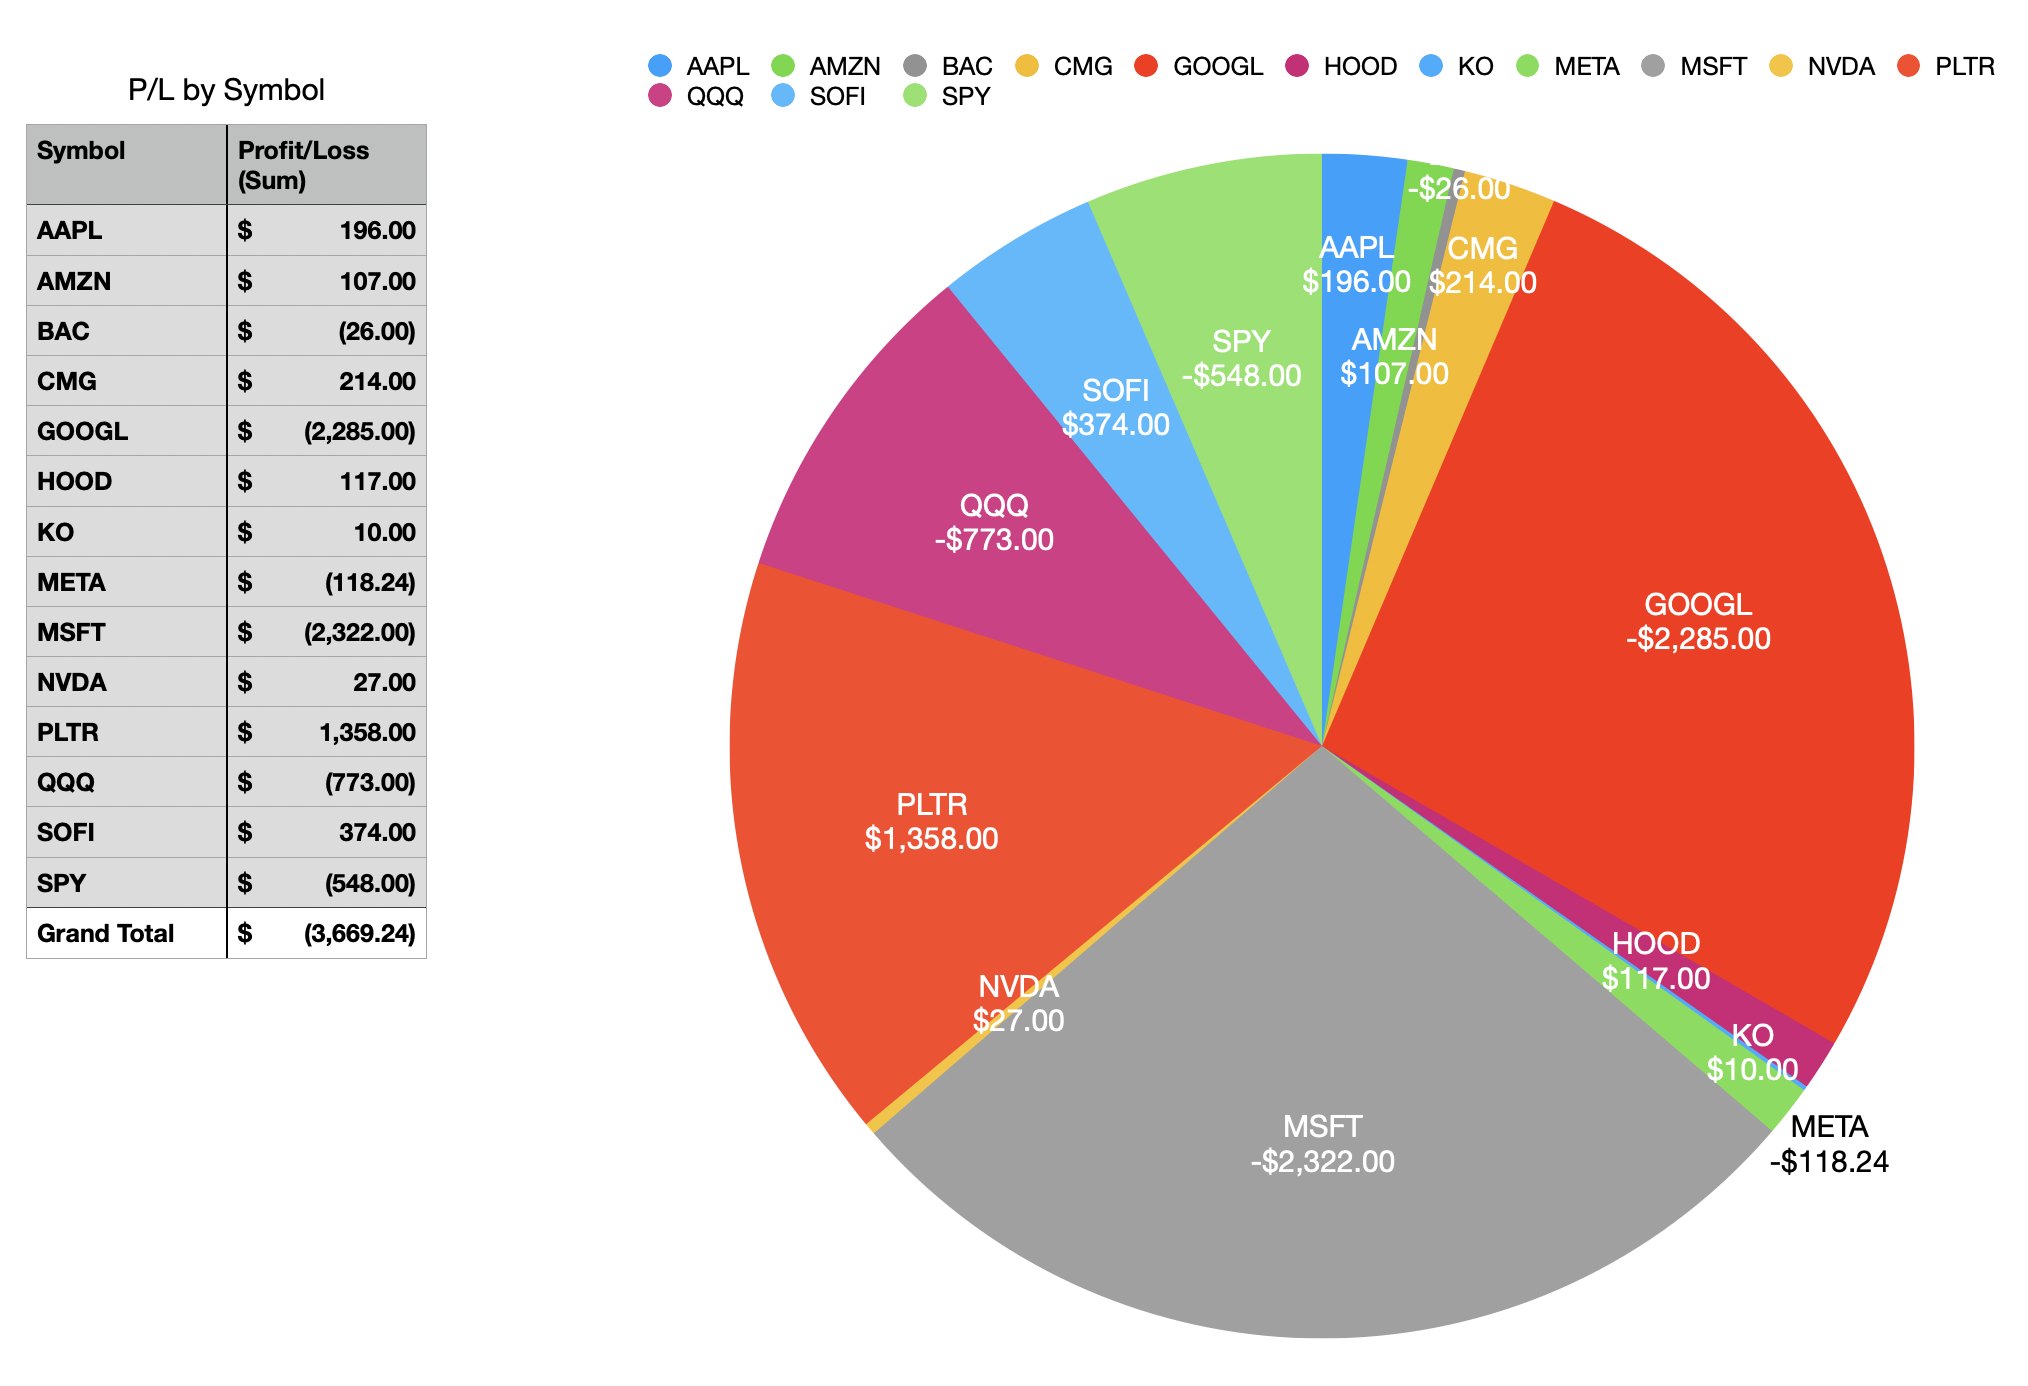
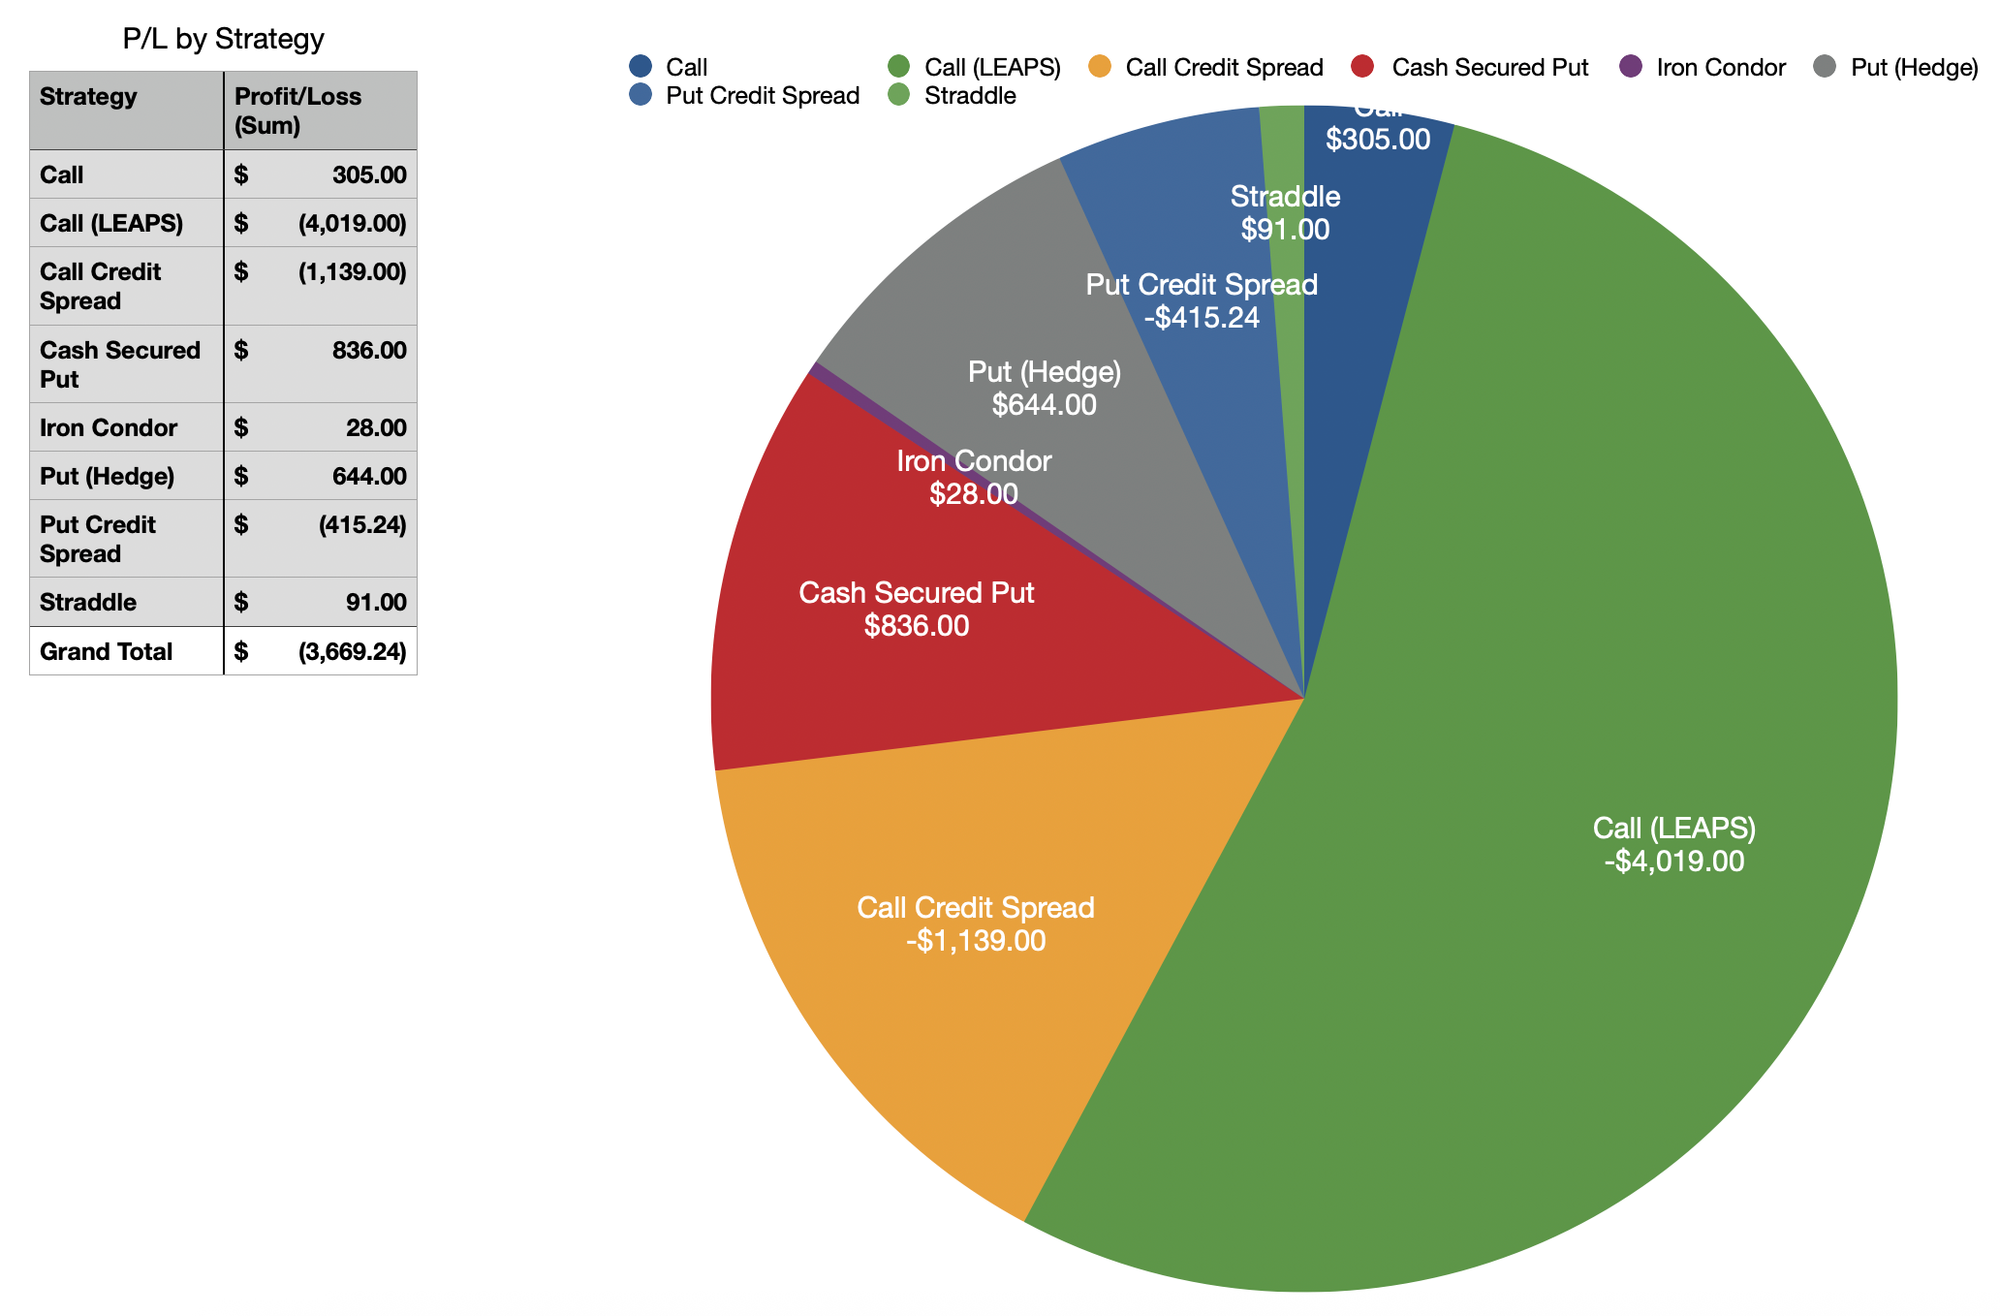
Here is the latest snapshot of how my trades have performed across strategies and tickers:

Here are a couple of tables showing my Win Rate by Strategy.

Plan for Next Week
I am moving some of my funds from Robinhood to TastyTrade.
A couple of interesting observations during the move by Robinhood - the platform charges some interest if you want to do an instant transfer. The only reason it is even a business model for them is because US banking regulations do not allow instant transfers in the classic sense where I send you money and you get it right away. Some banks do allow limited instant transfers free of cost, such as my Chase Checking account. It is quite surprising in this day and age for US banking systems to not allow instant transfers by default.
Anyway, what that means is I will be capital deprived for a week or two since I first need to transfer out of Robinhood and into my Checking account, and then initiate another transfer out of Checking and into TastyTrade.
Until then, I need to wait.
Thanks for following along - see you next week!
📌 Disclaimer: Nothing on this site is financial advice - I’m just here to entertain! Here’s my introduction, my trading philosophy, and some ground rules.


