
Day 115

Is the AI money moving out? My bullish positions in Intel and Micron got tested. I backed off and am now leaning neutral across my overall portfolio.
Portfolio Status
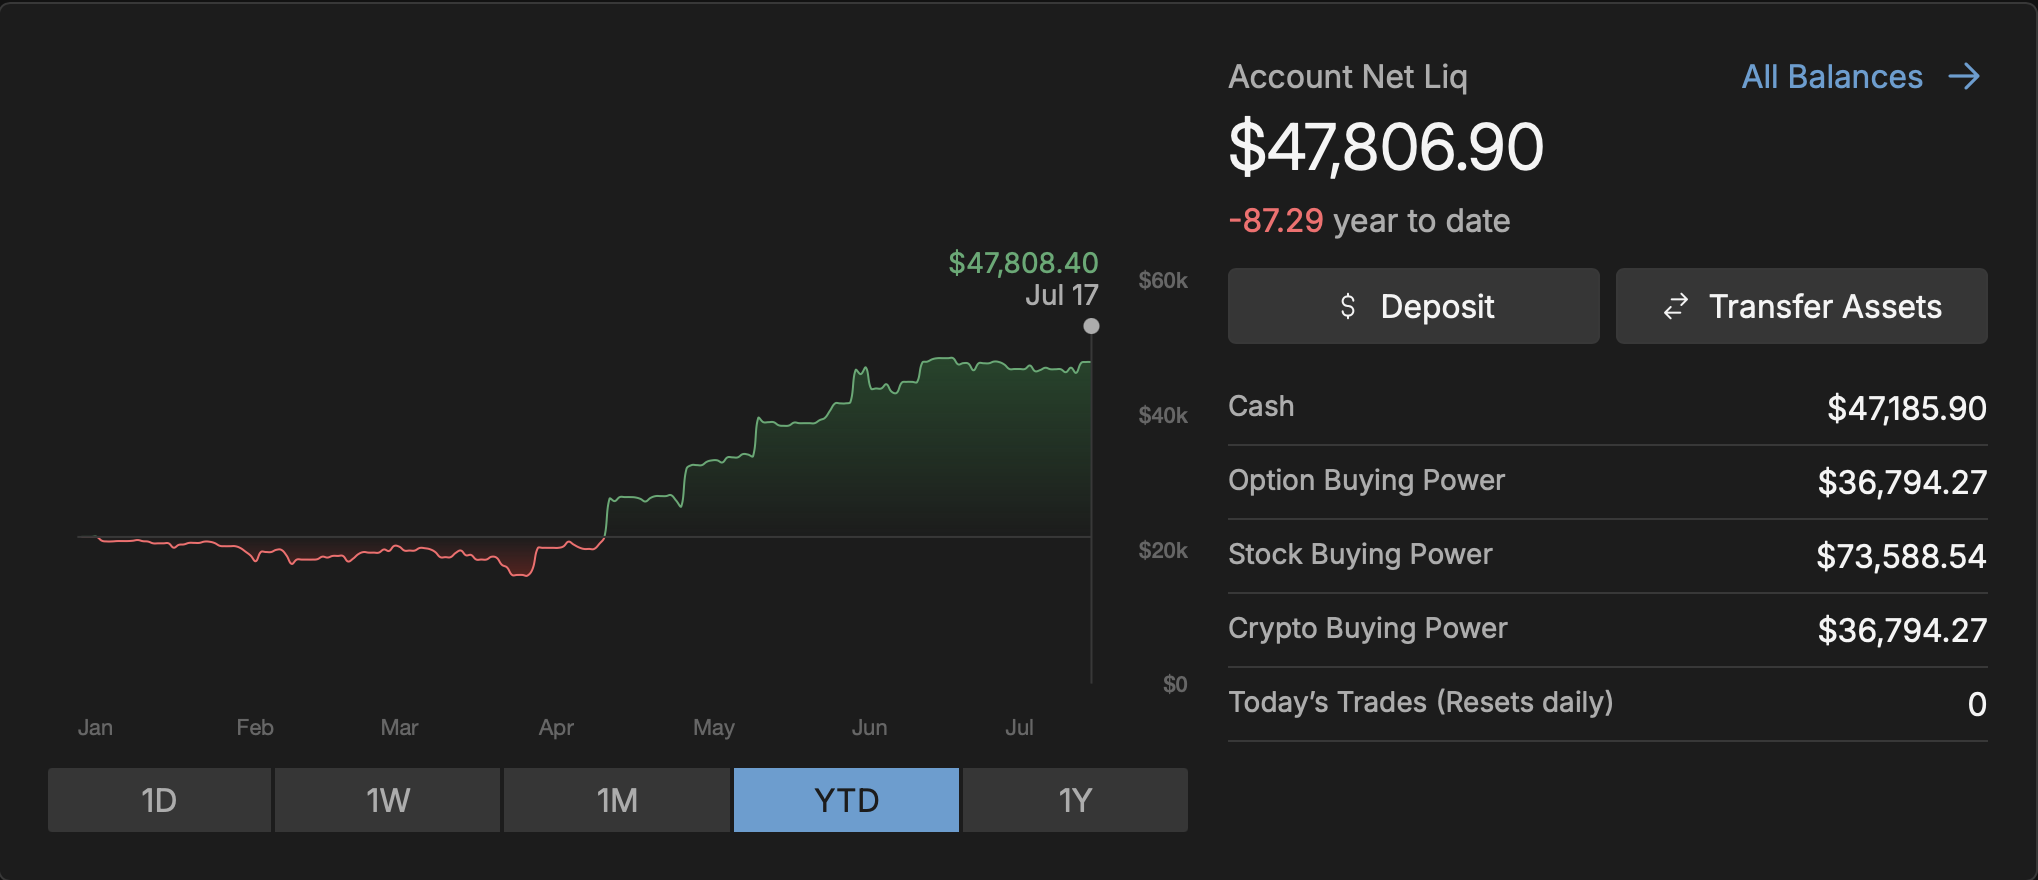
Here is the current portfolio status, including unrealized Profit/Loss. My current portfolio balance is just under $48K.
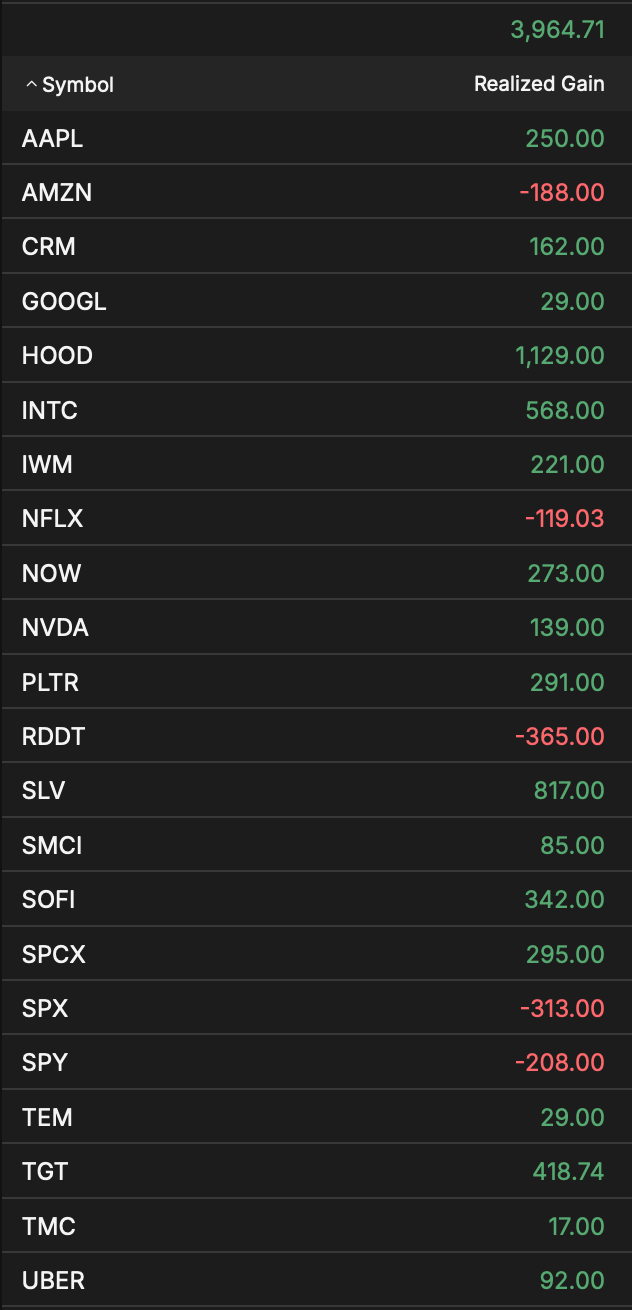
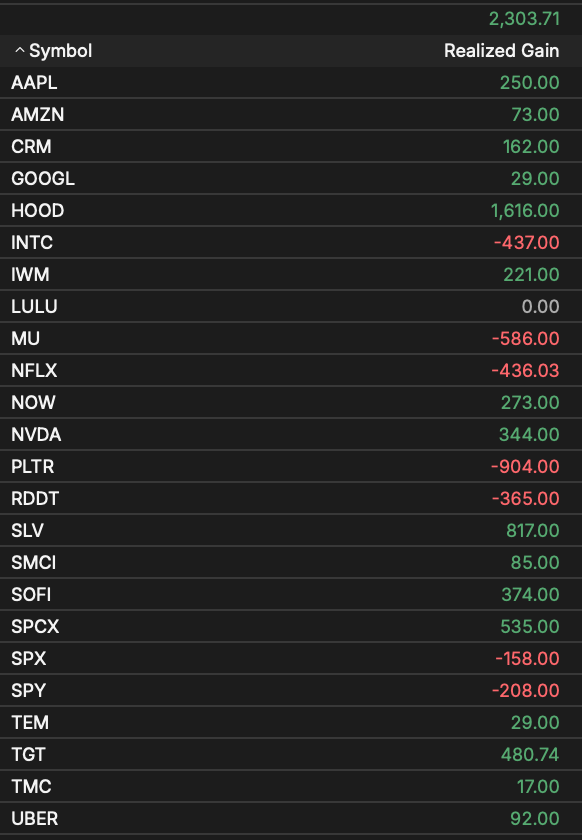
Here is the entire Year to Date P/L list for closed positions - I added previous post's list here for comparison.
I took decent sized losses in PLTR, INTC, MU, and NFLX.
I made some money by shorting MU, but then went long in both MU and INTC thinking AI would continue to boost these up, but since then most AI adjacent stocks have been on a slow decline.
My overall profits for the year is down to $2.3K.
Market Recap
SPY is at ~$743, and QQQ is on ~$695. Both are down, but QQQ dragged down more than SPY.
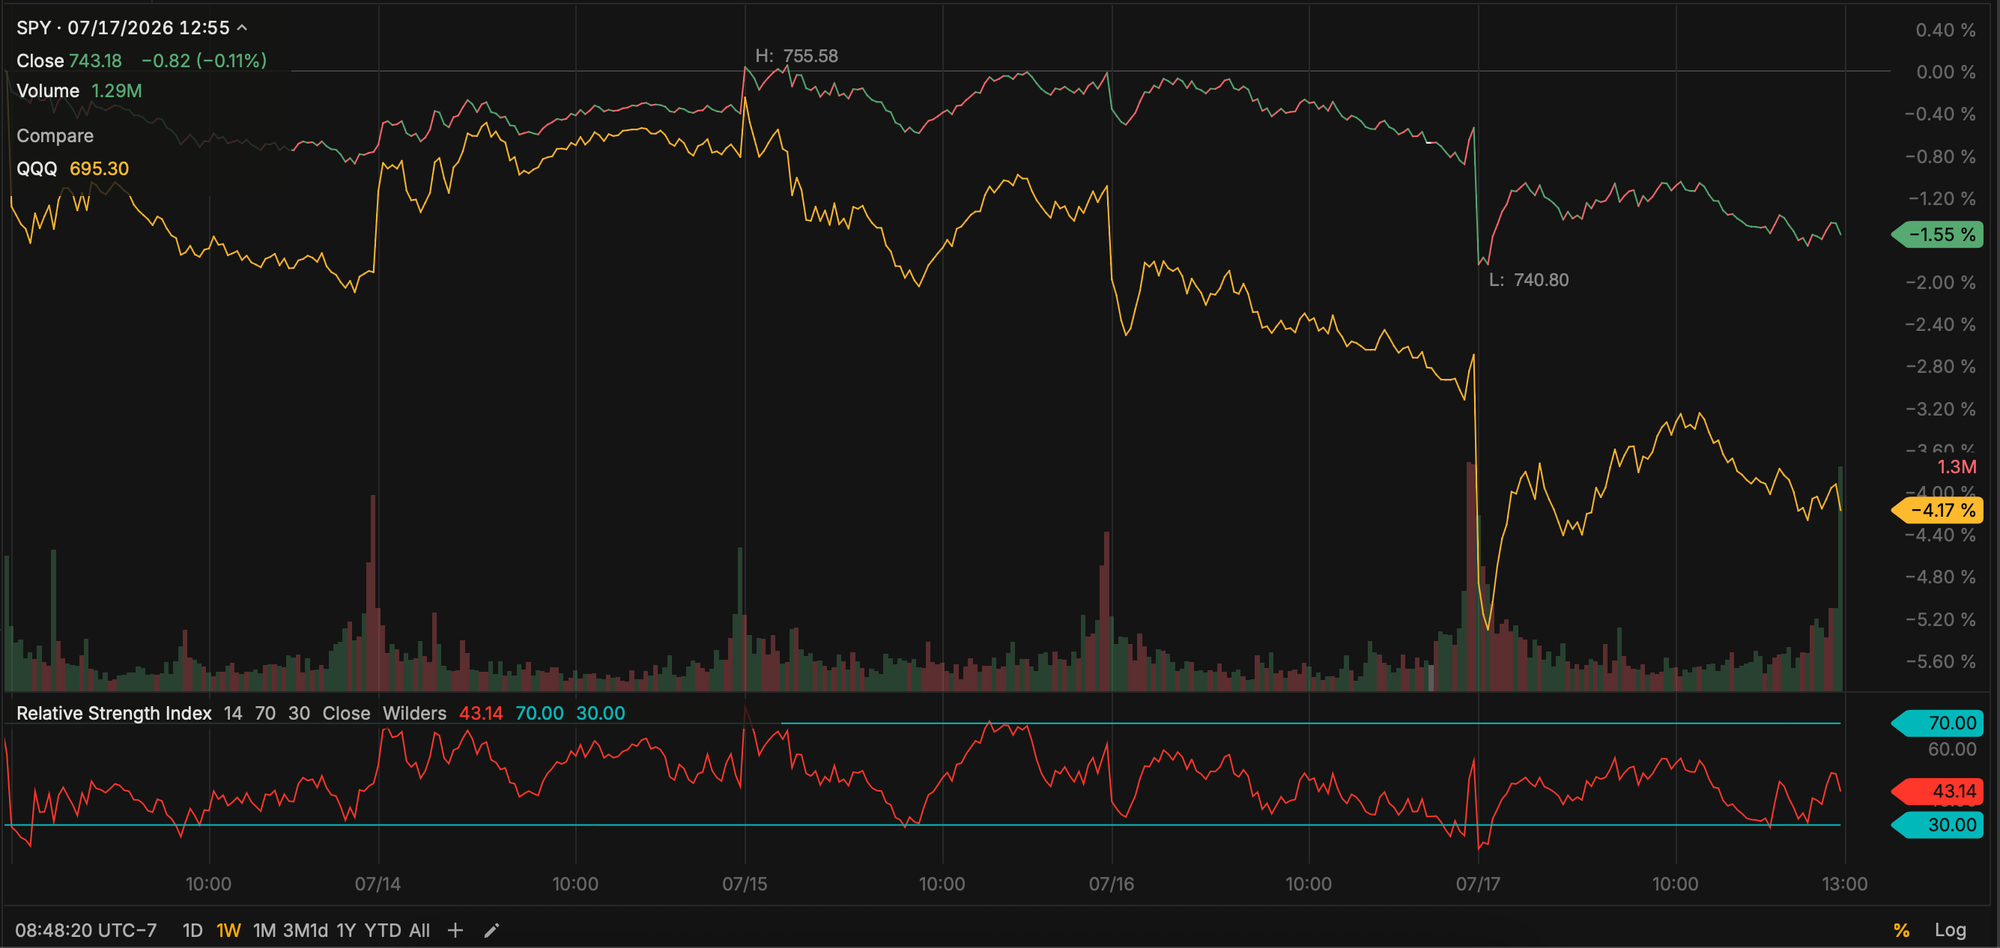
VIX is ~18.8.
Current Positions
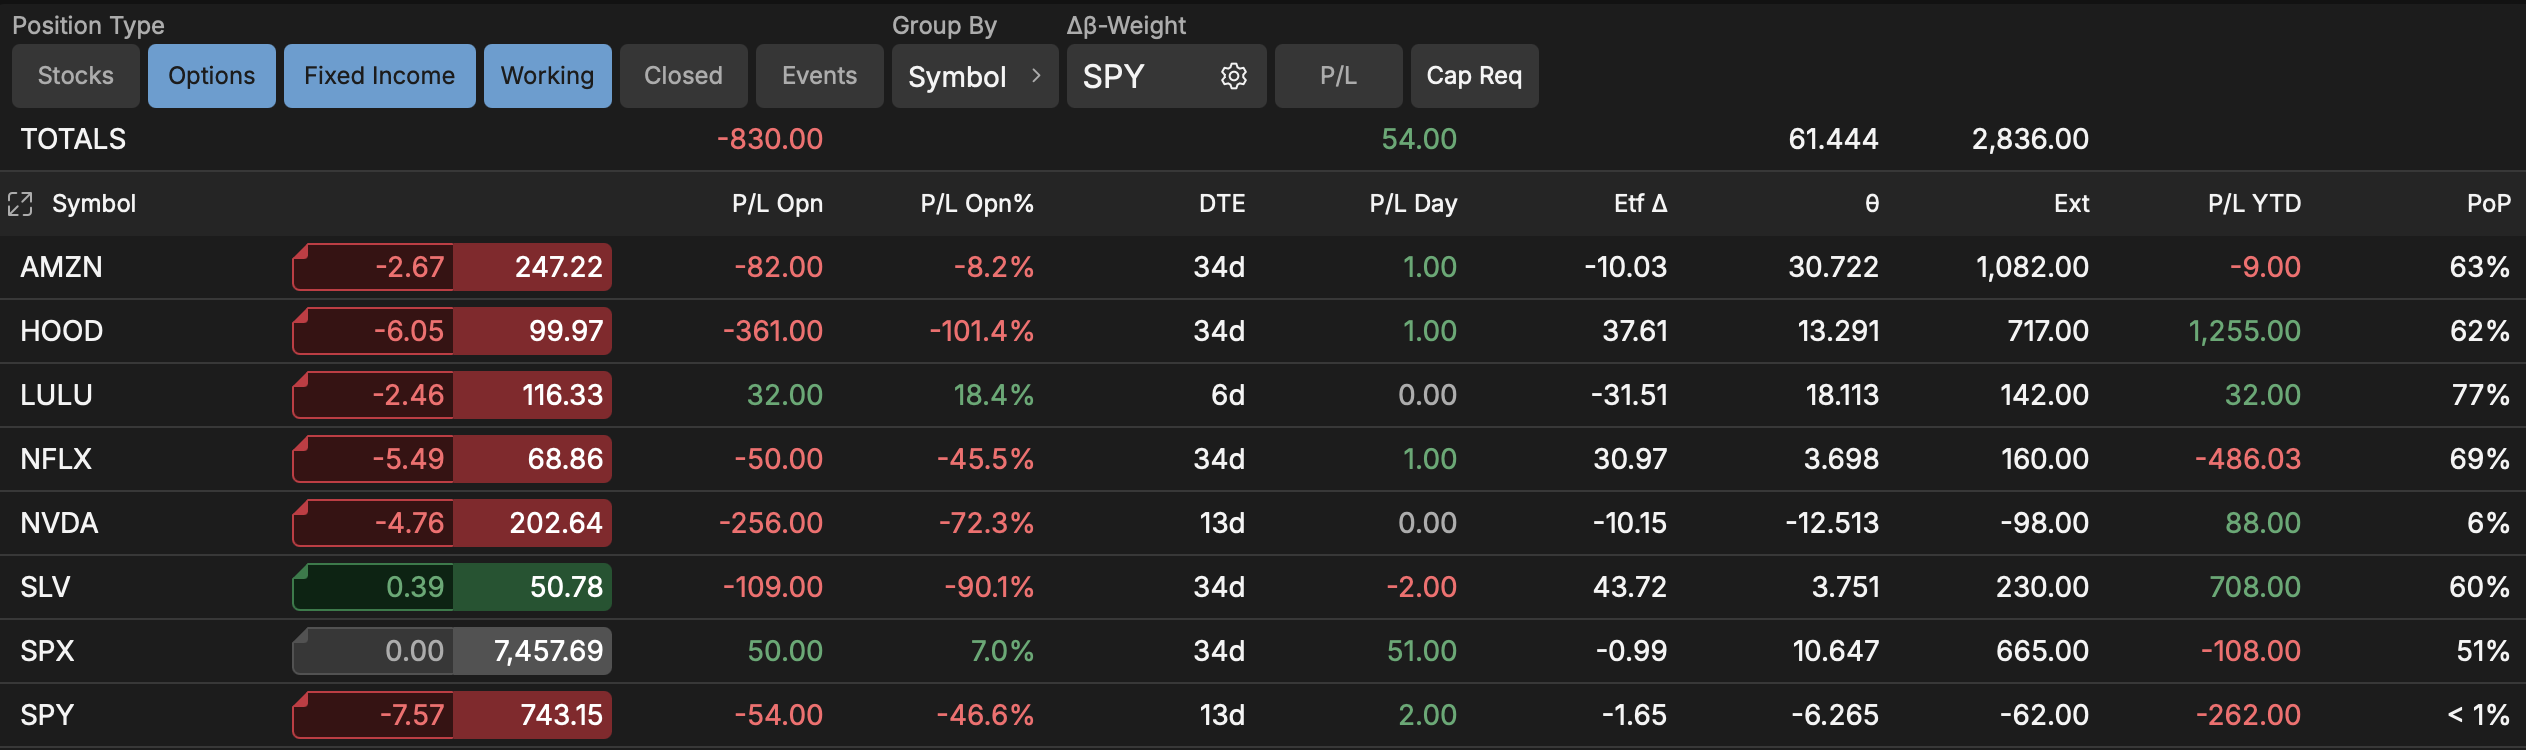
I have 6 premium selling option positions, 1 hedge I paid for and 1 hedge I got for free. My daily theta across all the positions is ~$61 and my overall portfolio delta is 1.
The primary hedge is in SPY, in case market tanks 30%. I have written about this always-on hedge in the past: https://www.foolishtrader.com/the-arithmetic-of-survival-one-path-and-the-geometry-of-wealth/.
The other hedge is in NVDA - I had sold a call credit spread and plowed the premium I received from that straight into buying a Put. NVDA didn’t quite drop as much as I expected - in fact it moved up since I put that position on - but because I didn’t have to pay any more for the Put - I am leaving it on in case there is 5-10% correction in NVDA.
Now to the premium selling positions.
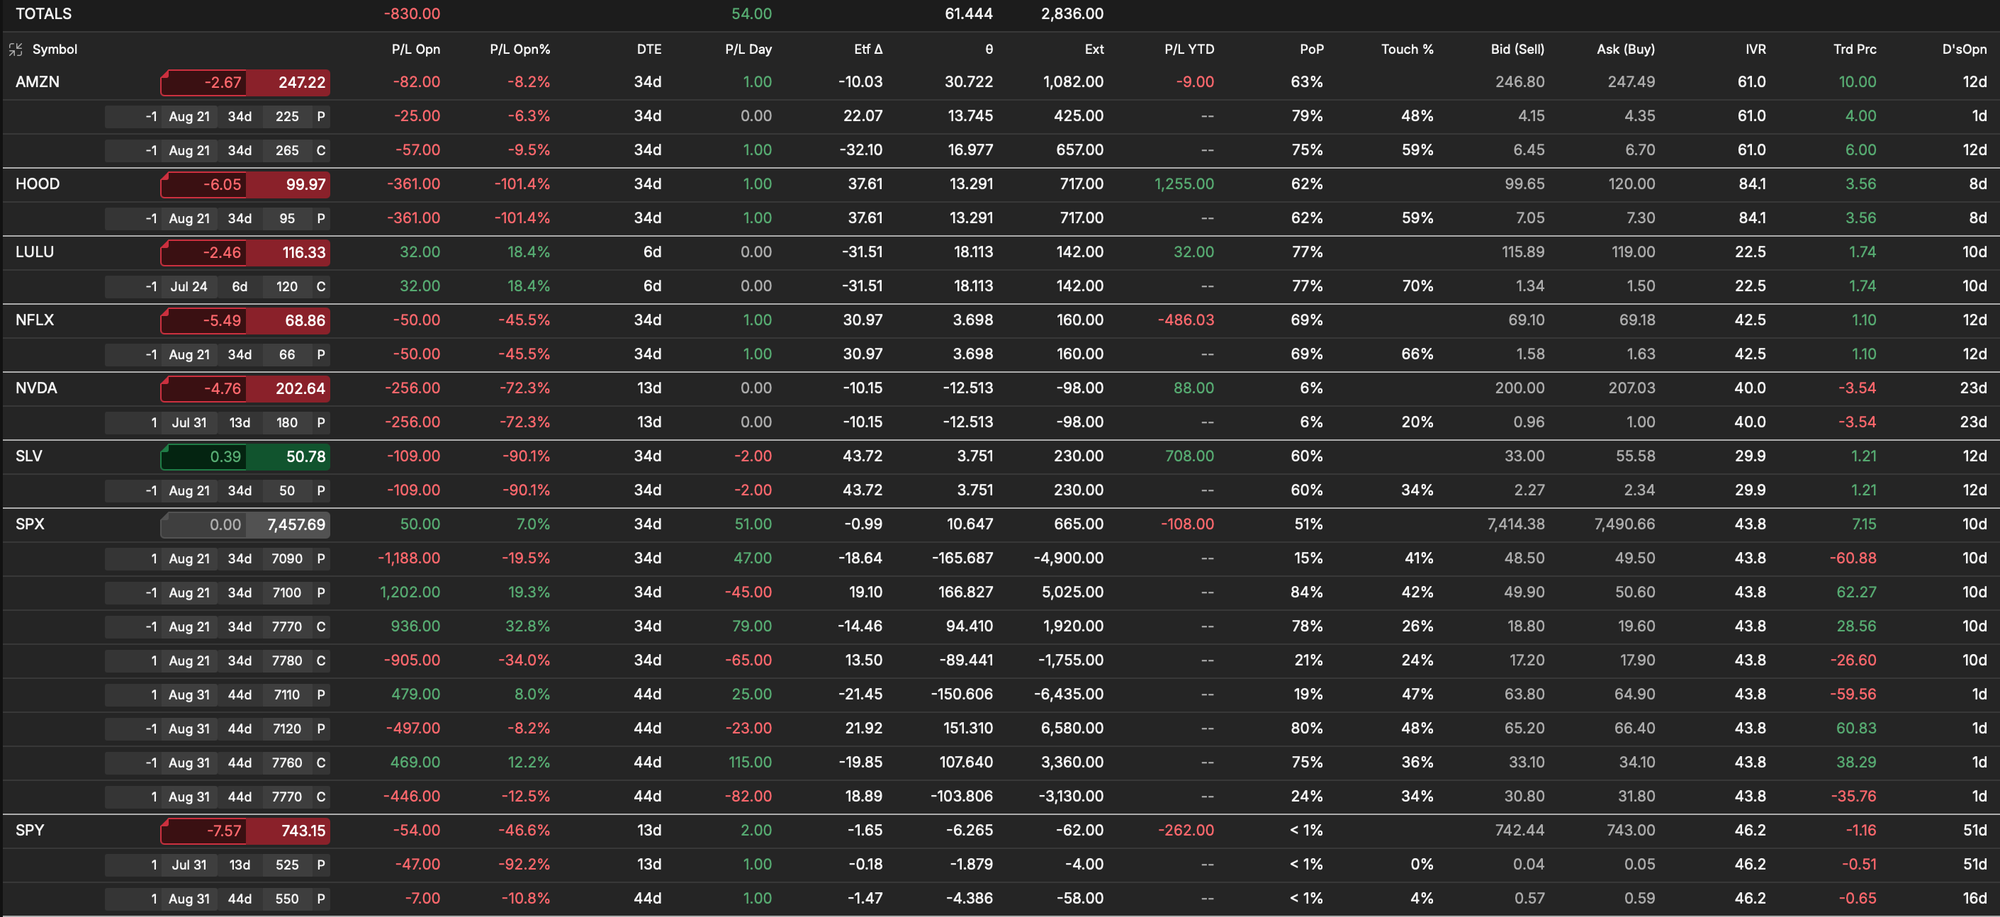
Neutral on AMZN, sold 1 August 21 Strangle. The puts have been rolled upward a couple of times as Amazon inched higher, locking in some profits along the way. Now hoping it stays within its expected move range through expiration.
Long HOOD via a single August 21 $95 put.
Short LULU, an unusual entry since I usually don't open positions inside 36 days to expiration, but broke that rule here. The bet is that LULU won't rally, or if it does, not violently past $120. Short the July 24 $120 strike.
Long NFLX, having sold an August 21 $66 put.
Long silver, having sold an August 21 $50 put.
Neutral on SPX, running two iron condors, one expiring August 21 and the other August 31.
Here are the detailed positions.
H1 2026 Reflection
Ok, it's not that reflective. I basically downloaded all my trades and transactions and fed it to Claude. This is what it gave me as response.
AI Heads Up: The following section is AI-generated.
The headline
Your first half closed at $2,115 after commissions and fees, across 189 closed trades and an 83% win rate. That sounds healthy until you compute what the win rate needed to be. With an average winner of $98 against an average loser of $416, the book had to win 81% of the time just to break even. You cleared that bar by two points. Six months of trading for a two-point margin.
Three habits ate the difference. Cut them and the same six months returns somewhere between $5,400 and $6,700. Everything else you did made money.
What's working
Selling undefined-risk premium on calm names is carrying the account. Short puts, short calls, and short strangles on HOOD, SLV, INTC, AAPL, and TGT ran 100 trades at an 89% win rate for +$2,592. Strike selection there is doing real work and shouldn't change.
The 40-to-46 DTE SPX iron condor is the other winner, and it's the only SPX bucket where your win rate beat the win rate the trade actually required: 84.6% against a needed 77.5%, netting +$657 on 13 trades. The canonical tastytrade trade, run the canonical way, works.
What's costing you
Wide SPX put credit spreads. Sixteen of them at 20 to 25 points wide, down $3,289 combined. Three went to something close to max loss: -$1,650 on a same-day 20-wide, -$1,185 on a 5-DTE 20-wide, -$1,060 on a 7-DTE 20-wide. Width alone isn't the villain, since your iron condors ran the same 20 to 25 points and made money. What separates them is the second short strike. In a condor, it sits far from spot and gets managed around. A standalone put spread sold close to the money is a directional bet dressed up as premium selling, and when the tape goes against it there's nothing on the other side to soften the hit.
June 5 is the whole problem in one morning. A 7-DTE 20-wide put spread at 6:37am. A 0DTE 20-wide put spread ten minutes later. Short delta stacked on short delta into a falling market. Both maxed out by the close.
Two single trades, not a whole category. PLTR and NFLX both looked like problem names in the undefined-risk book, until the individual trades were broken out. PLTR was 8 small wins and one -$1,499 loss on June 3. NFLX was 4 small wins and one -$573 loss on June 4. RDDT is only 2 trades, too small to read as a pattern. The initial read was "high beta," but INTC, a comparably volatile name, went 8-for-8 in the same undefined-risk book for +$556 with no losers at all. Beta isn't the variable. One outsized trade per name is. June 3 and June 4 landing back to back on PLTR and NFLX looks like an earnings-adjacent short that went undefined-risk into a move it wasn't sized for. Worth confirming against your own records before treating it as settled.
0DTE long options. Five same-day lottery tickets on SPX, two calls and three puts, down $1,197 with a single winner among them. One debit call expired at zero for -$842.
SPX by days to expiration
| Bucket | Trades | Win rate | Win rate needed | Net |
|---|---|---|---|---|
| 0DTE | 50 | 74.0% | 75.9% | -$549 |
| 1-7 DTE | 17 | 82.4% | 85.8% | -$518 |
| >7 DTE | 13 | 84.6% | 77.5% | +$657 |
The middle column is the one that matters. Both short-dated buckets win most of the time and lose money anyway, because the losers are so much bigger than the winners that a 74% or 82% hit rate isn't enough. Only the longer-dated condor book clears its own bar.
Costs make it worse. SPX generated $605 of the $820 in commissions and fees this year across 80 closed trades. Total cost drag came to 28% of gross realized P/L. The 0DTE churn is where most of that went, and it bought nothing.
The losses aren't streaks
The win/loss sequence over six months is statistically indistinguishable from a coin flip landing 83% heads. No cold stretch, no revenge-trading spiral.
What clusters is dollars. The top three losing trades account for 33% of every loss dollar booked. The top five account for 47%. That's a construction problem with a rules fix. The one exception is same-day stacking, which is how June 3 (-$1,200) and June 5 (-$2,623) became the worst days of the year.
Three rules for the back half
Cap standalone SPX put credit spreads at 10 to 15 points. Anything wider only goes on as a condor, where the far side earns its keep.
Check the earnings calendar before selling undefined-risk premium on any name, and size or structure around confirmed event dates instead of avoiding names by feel.
No 0DTE long options. No same-day re-entry after a short-delta position stops out.
An 83% win rate and clean underwriting on the quiet names say the process is sound. Sixteen wide put spreads and five lottery tickets say the rulebook has three holes in it. Patch them and this half was a $6,000 half.
Caveats: this covers options only, so the equity P/L from assigned SOFI and HOOD shares sits outside it. Rolled positions count as separate trades, which understates a few chained losses. And none of this sees implied volatility or Greeks on the open book.
Claude Prompt
If you want to do a similar analysis, here is the prompt you can use. I would recommend the latest model you can afford - I had used Opus 4.6.
I'm attaching CSV exports from my broker covering a period of my options trading. Analyze my trading and tell me what's working, what patterns show up, and what to change. Lead with answers, commit to conclusions, and write in prose without false balance. This isn't financial advice, but still give me a clear recommendation. Use code to reconstruct the trades rather than eyeballing the files.
Follow these rules so the analysis is accurate rather than approximate.
Reconstruction and reconciliation. Take headline P/L (realized, open, commissions, fees, net) from whichever export is the authoritative summary. Reconstruct individual trades from the granular transaction ledger by grouping opening legs (buy-to-open and sell-to-open) by order number, where each opening order is one trade. Compute each contract's realized P/L by summing value plus commissions plus fees across every row carrying that symbol. Detect still-open trades by summing signed contract quantity per symbol, where nonzero means open, and exclude those from closed-trade win/loss math while reconstructing current open positions separately. Keep all P/L net of commissions and fees, and report cost drag as a percentage of gross realized. Reconcile the reconstructed closed-trade total against the authoritative realized figure, and if they differ by more than a small tolerance, stop and investigate before trusting any breakdown.
Classification, verified before labeling. Classify every trade from its actual legs as an iron condor, credit spread (put or call, kept distinct), butterfly, strangle, or single-leg, matching whatever structures I actually trade [state your template here, e.g. "put credit spreads, call credit spreads, iron condors, and occasional butterflies"]. For single-leg trades, check the action: long options are defined-risk, short options are undefined-risk, and a long option is never "naked." Capture position size and spread width for every trade, since width is decisive. Flag anything outside my stated template and analyze it apart from the core book. Before drawing any conclusion from a classification, spot-check it against the raw fills.
Don't generalize a cause from one example. If a pattern looks like it's explained by a trait of the underlying (beta, sector, price, liquidity, whatever), test that explanation against at least one other name I traded with a similar trait. If a comparably volatile or comparably sized name performed fine, the trait isn't the actual variable and the explanation needs to be corrected to whatever the data actually shows (often: one large trade concentrating the damage, not a whole category being bad). Don't let a first-pass label survive contact with a counterexample.
DTE segmentation, for any instrument traded across a range of expirations. Bucket by 0DTE, 1-to-7 DTE, and greater-than-7 DTE. For each bucket compute trades, win rate, average win, average loss, expectancy per trade, worst trade, net P/L, and the breakeven win rate (absolute average loss divided by the sum of average win and absolute average loss). The signal is the gap between actual and breakeven win rate, not the raw win rate, since a bucket can win most of the time and still lose money if the loss-to-win size ratio is bad.
Run the math twice. Once as-is, and once filtered to my stated strategies only, at standard size and standard width. Show how a few off-template or oversized trades distort the aggregate, and report the standard book's true edge.
Clustering and streaks. Run a runs test (or equivalent) on the chronological win/loss sequence to check whether outcomes are streaky or indistinguishable from random. Check same-day clustering and loss-dollar concentration (what share of total loss dollars comes from the top two or three losing trades). Distinguish clustering in time, which points to streaks or behavioral tilt, from clustering in dollars, which points to a few large trades, because the two have different fixes.
Time-of-day, for intraday or 0DTE trades. Convert timestamps to market time and state the timezone. Bucket entry time and compute win rate and expectancy per window, and caveat small samples honestly rather than claiming a time-of-day edge from a handful of trades.
Cross-cutting. Report loss concentration by underlying. Keep realized and open P/L separate throughout.
Stance. Start from the working hypothesis that win rate and position sizing are usually fine and that the variable driving results is loss size, set by width, structure, off-template trades, and underlying selection, then test that rather than assuming it. Separate rules problems (width caps, a structure whitelist, defined risk on volatile names) from skill problems. State data limitations plainly, including any exports that can't see live prices, implied volatility, or Greeks.
Once the analysis is done, I'll likely ask you to rewrite it for a blog or newsletter post. When that happens: strip anything that reveals your internal process rather than telling the reader something useful (no "I reconstructed X from the ledger," no "I checked the raw fills," no naming the statistical test used, no methodology narration in general). Translate every statistical finding into what it means for the reader, not how it was computed. Keep the tone committed and direct, no hedging, no filler, no "X, not Y" constructions, no closing with an offer to elaborate.
For what it's worth, I think the analysis is quite good. And it's mainly because I had already started to spot some issues I wanted to adjust for the second half of the year. The primary adjustment is to reduce the number of Zero DTE trades and to roll sooner when positions move against me.
However, note that you must have your own critical point of view when reading AI-generated information - I had to nudge it to correctness since it got a few things wrong on the first few tries.
But if you can't seem to get a hold of what it is you are doing, I have to say trying out will at least get you closer to understanding your own trading behavior.
Thanks for reading.
📌 Disclaimer: Nothing on this site is financial advice - I’m just here to entertain! Here’s my introduction, my trading philosophy, and some ground rules.