Day 75
Market Recap
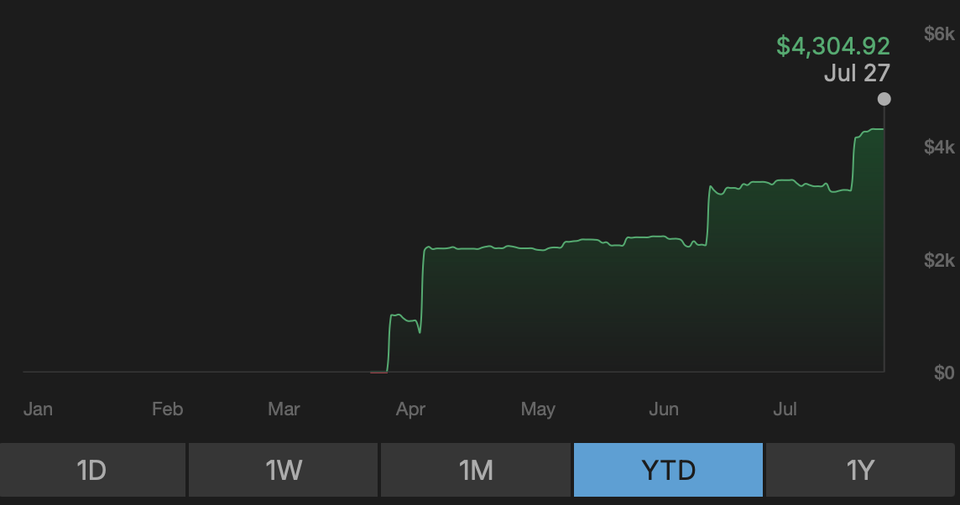
The market moved up a little last week. SPY moved up by ~12 points and QQQ moved up by ~8 points.
- SPY: +11.70 (+1.86%)
- QQQ: +$7.73 (+1.38%)
Year-over-year:
- SPY: +$97.72 (+18.02%)
- QQQ: +$107.24 (+23.18%)
Trading Update: July 21 – July 25, 2025
Here is a summary of all trades I made during the week (details listed below).
- Unrealized Profit/Loss: +$252
- Realized Profit/Loss: +$66
- Buying Power Used: $1.37K
- Buying Power Remaining: $3.2K

Trades
I did not place many trades this week.
I closed a PLTR Put Credit Spread at ~33% of original premium. I had hoped it will get to 50% faster but the rate at which it was happening was playing with my patience. I did not want to risk taking the trade into the next week (which would have been the ideal 21 DTE exit) because that would be an earnings week for PLTR.
Then I spotted TGT having higher volatility than usual and made a quick in and out trade (by my standards), capturing ~35% of the premium in less than 24 hours. This was a fantastic mechanical trade and gave me a lot of satisfaction - the IV% was > 50% on TGT - I did not care about the reason - the option price had a very high premium even at a measly 10∆, and of course the volume was great.
It is very hard to find such trades though. The way I discovered this trade was to go to a watchlist of high IV and high volume symbols, and then spot any tickers that I had in the past 30 days had tracked the movement of. So part science, part luck/timing.
Then I made a couple of earnings trades - one each on SOFI and HOOD who both have upcoming earnings.
Portfolio Status
Closed this week slightly higher than last.
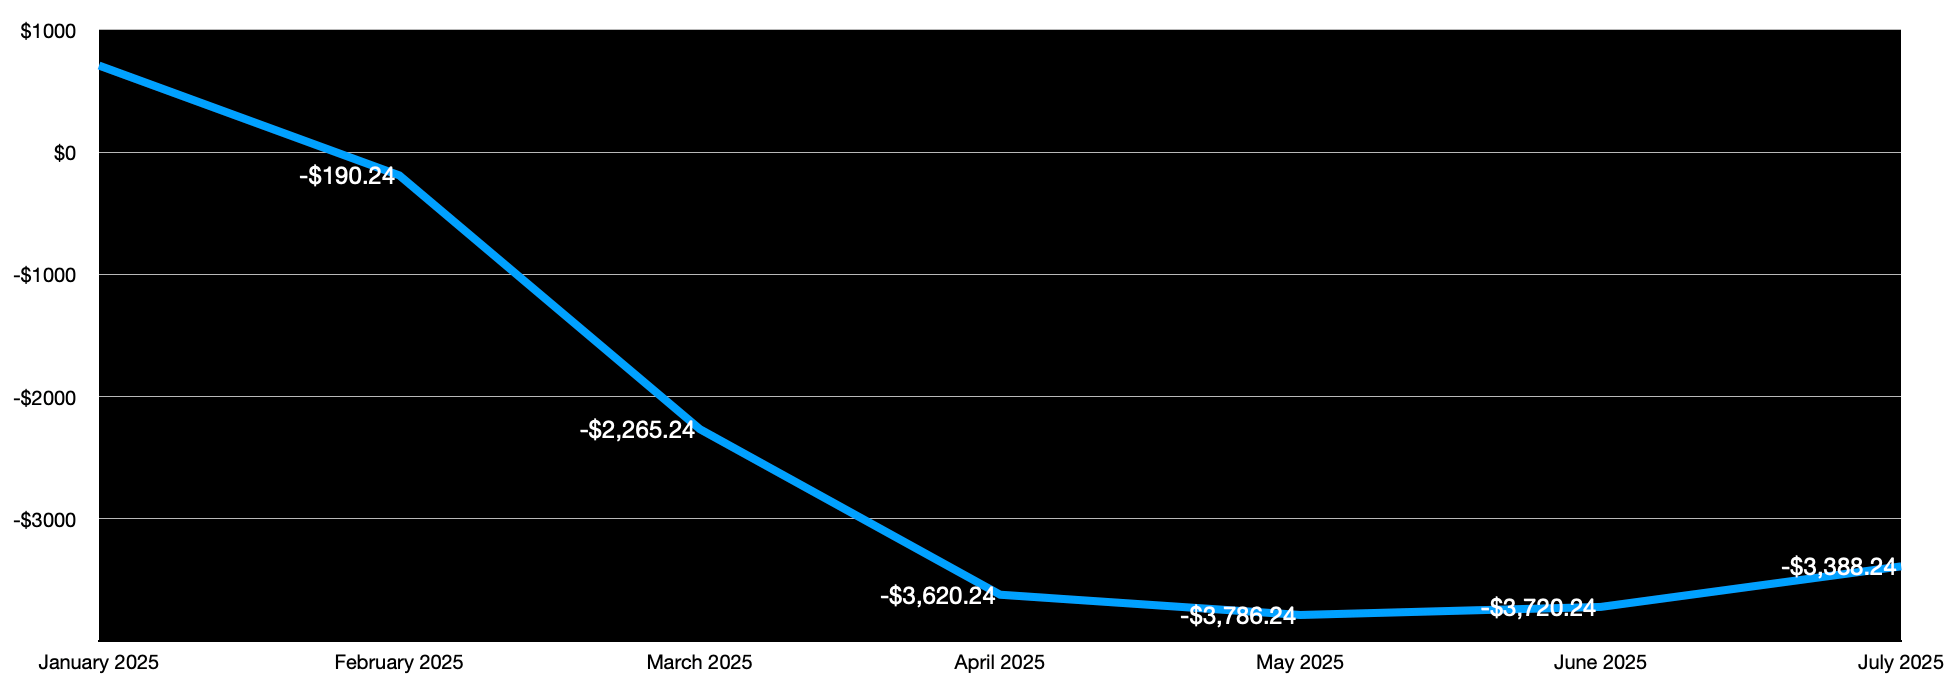
- 2025 Net P&L: Down $3.4K
- All Time: Down $6.43K
Profit and Loss Trend - Monthly - Year to Date
Portfolio Strategy Breakdown
Here's a view showing my Win Rate breakdown by strategy deployed.
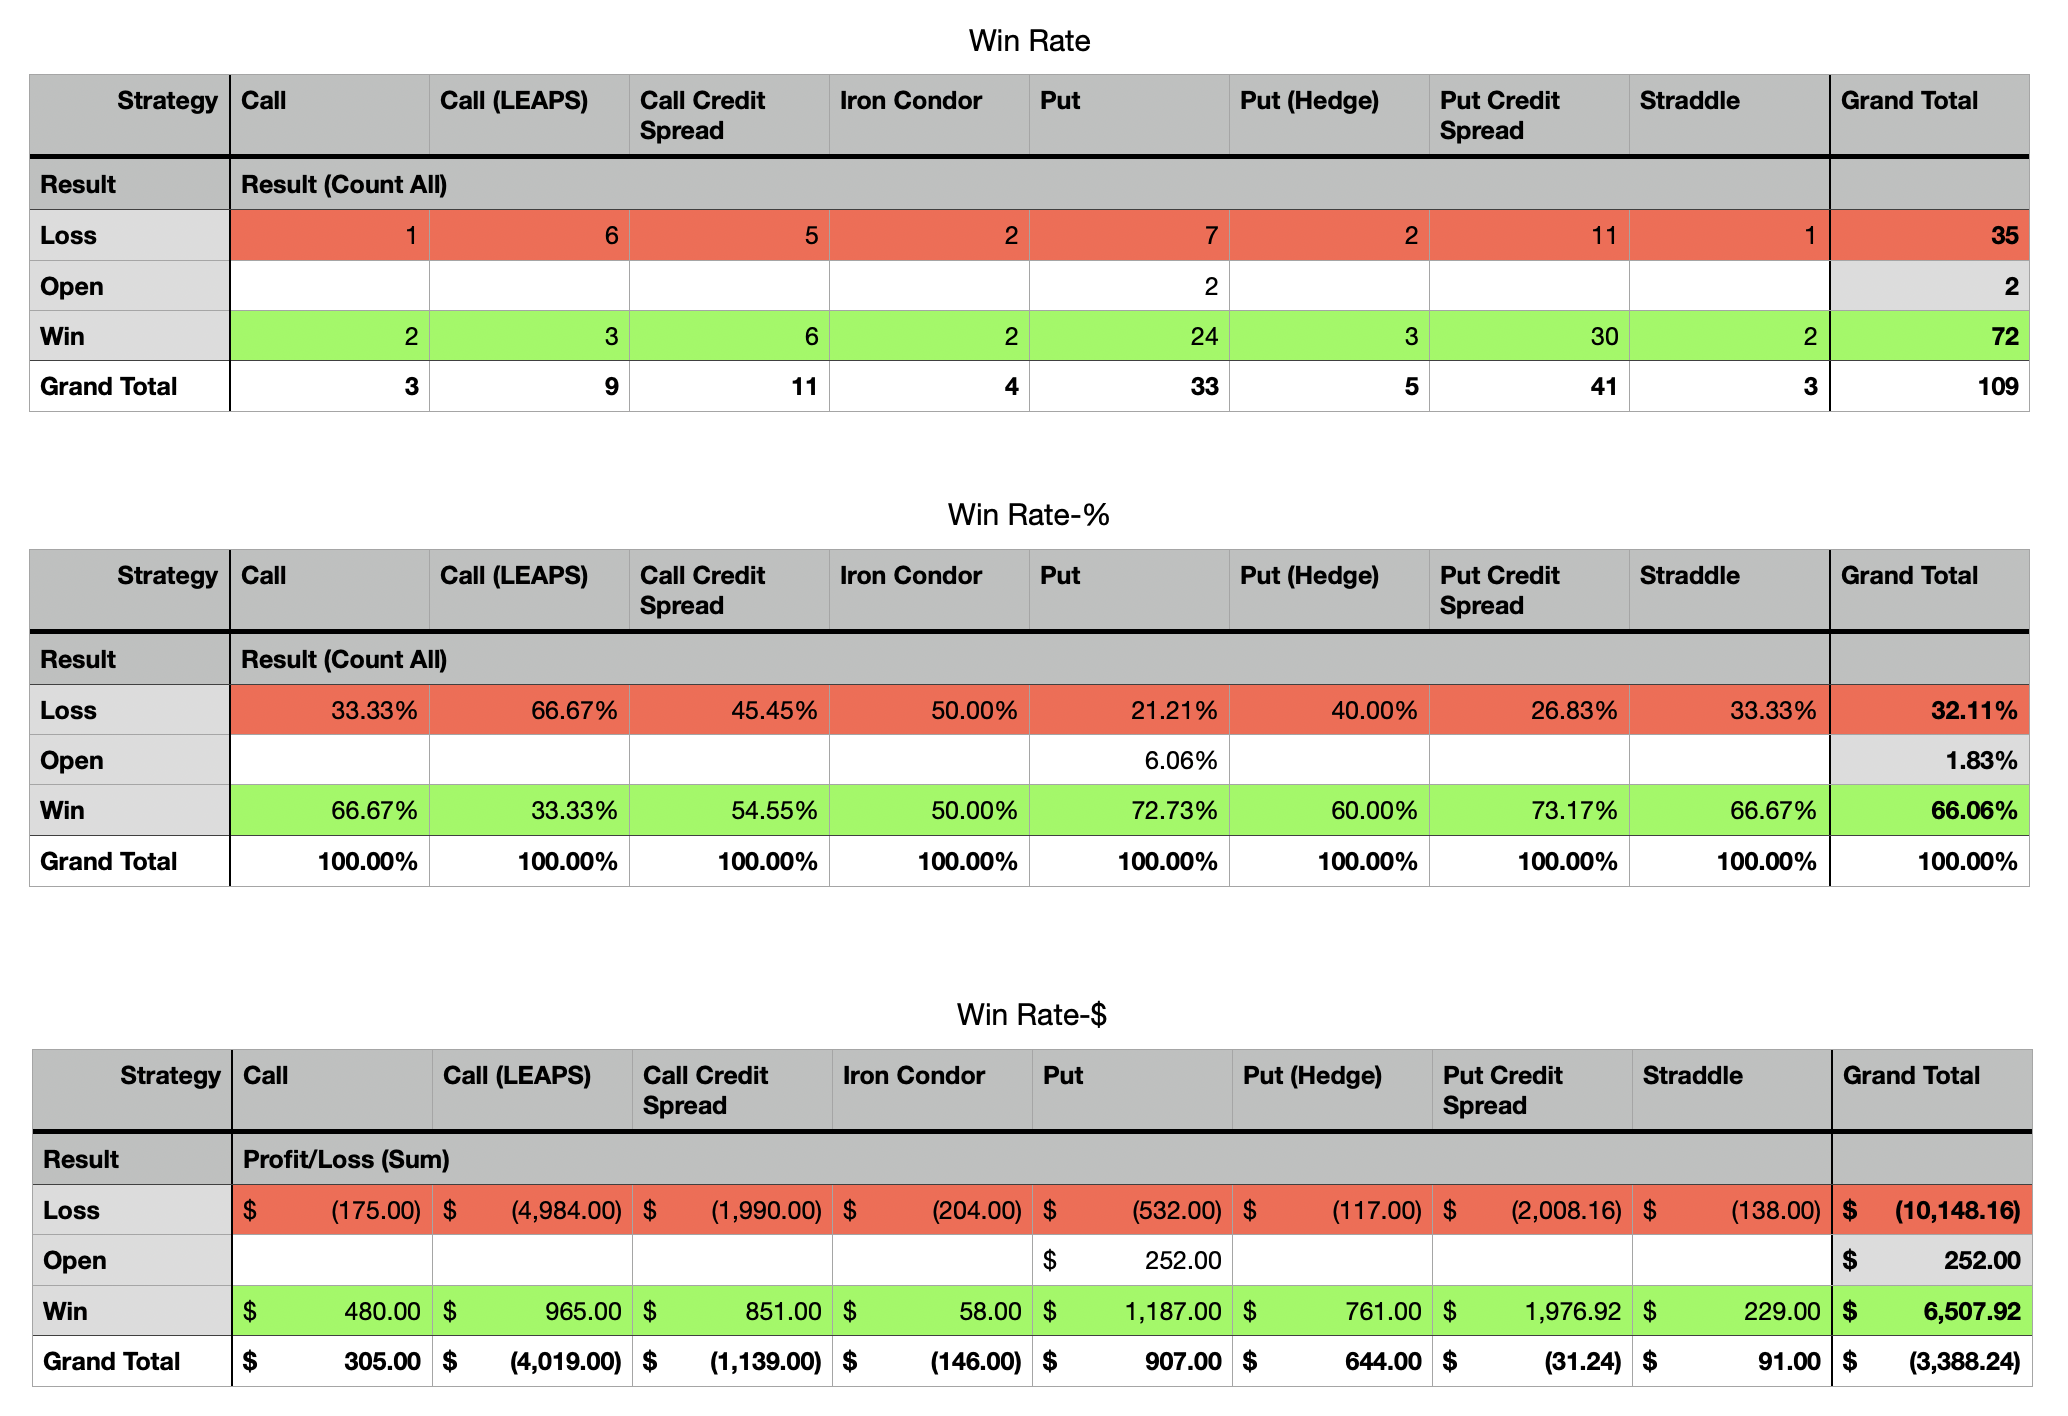
Here is a breakdown of P/L by strategies I have used so far.
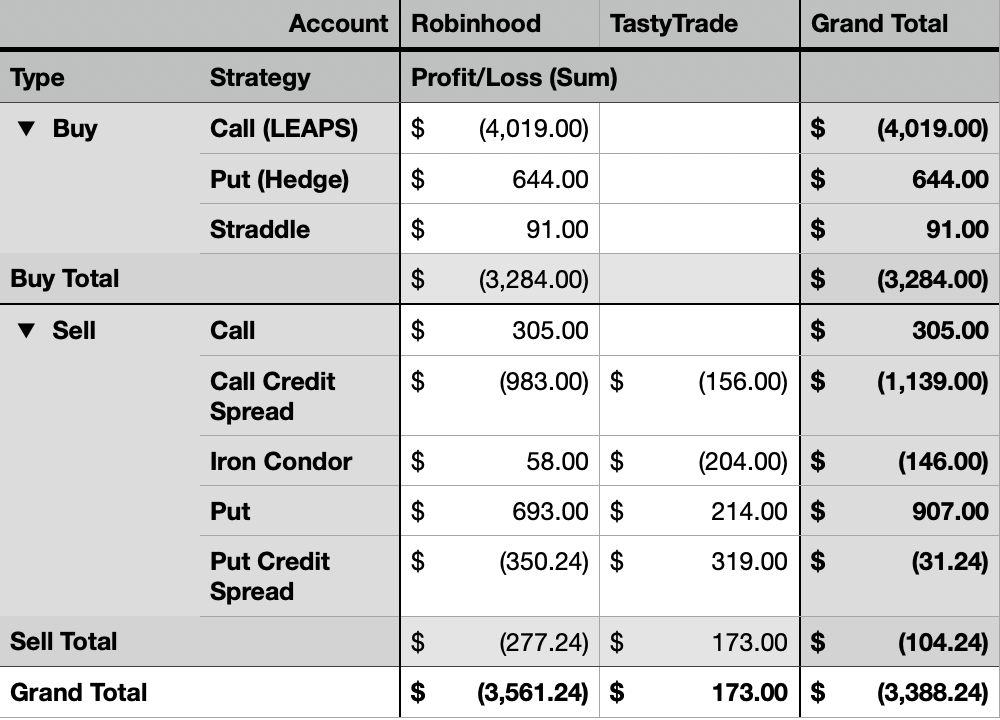
- Best Performing Strategy: Sell Put
- Worst Performing Strategy: Call (LEAPS)
Plan for Next Week
Traveling again. I may try to squeeze in another couple of trades.
I do not quite have a plan for what I will trade though.
I have been unable to bring my losses to under 3K now for the past 4 months, but have been able to prevent significant drawdowns since then and thus have kept the portfolio alive.
One observation with this experiment is that the work generates a lot of data points. I wish there was an easier way to manage all of this activity and draw more statistical conclusions about my trading behavior instead of the crude Numbers spreadsheet I have been using. Perhaps there is an opportunity in here somewhere that I will explore.
Thanks for following along - see you next week!
📌 Disclaimer: Nothing on this site is financial advice - I’m just here to entertain! Here’s my introduction, my trading philosophy, and some ground rules.


