Day 93

Read for how I manage a speculation that went bad, and how my current positions indicate a higher appetite for risk than recommended.
Market Recap
Both the SPY and the QQQ slightly lost value through the week, with tech sector suffering a bit more than other stocks.
Last Week:
- SPY ($681.89): -$4.11 (-0.60%)
- QQQ ($612.80): -$13.20 (-2.11%)
Last 1 Year:
- SPY: +$75.49 (+12.45%)
- QQQ: +$82.34 (+15.52%)
Year To Date:
- SPY: +$92.50 (+15.69%)
- QQQ: +$98.50 (+19.15%)
VIX continues to be below 16.
Trading Update: December 8 - December 12, 2025
I closed a single trade this week. There are other positions that are open, and they are mostly traditional sells where I will manage them if there is a sharp move or else wait until they reach their 21 DTE (Days to Expire) mark.
Back to the week, since IV had fallen below 16, I went looking for opportunities outside of my wheelhouse and noticed Lululemon (LULU) had upcoming earnings.
Now LULU is not a symbol I am familiar with in terms of its price trend. I just looked at the current price, where it was a week, a month, and a year ago, and made a speculation that it was trading in a range of $160 - $210.
Considering the stock had been bearish recently, I wanted an unlimited risk position for an upward move and a limited risk position for the downward move. I sold a $210 call that was a couple of weeks after earnings, and a $160/$150 Bull Put Spread.
And then, a day before earnings, LULU announced that they were going to change their CEO, and then announced they had a good last quarter. The price moved up sharply, breaching the $210 strike I had set. I first closed the $160 Put I had sold since it had made ~95% of its possible credit, and then waited a few minutes to see if the price would fall a bit so I was not holding on to an In the Money Call position. And then, I cut my losses and closed it out losing patience on how slow the price stabilization. And then of course, the price did stabilize and LULU is now at $205, slightly out of money from the position I was in.
Replaying this scenario - I think my instinct to cut the loss was right - there was no way for me to predict how high LULU could shoot up before stabilizing. However, my instinct to enter a <45 DTE trade on a symbol I had not been following was not quite right - I did not give myself enough chance at success.
Additionally, this taught me to be careful in low IV environments - selling premium in low IV can cause a big loss since volatility can swing high in either direction and you can look pretty foolish about your speculation.
Anyway, lesson learnt I hope. I lost $223 on this LULU setup. I have left the $150 Put position open since it has <$10 of residual value. I guess I can close it if something happens and LULU crashes causing the Put to rise in value.
Portfolio Status
In terms of wins and losses, this is now the second consecutive week I have lost money.
My last five weeks (latest first): L-L-W-W-W.
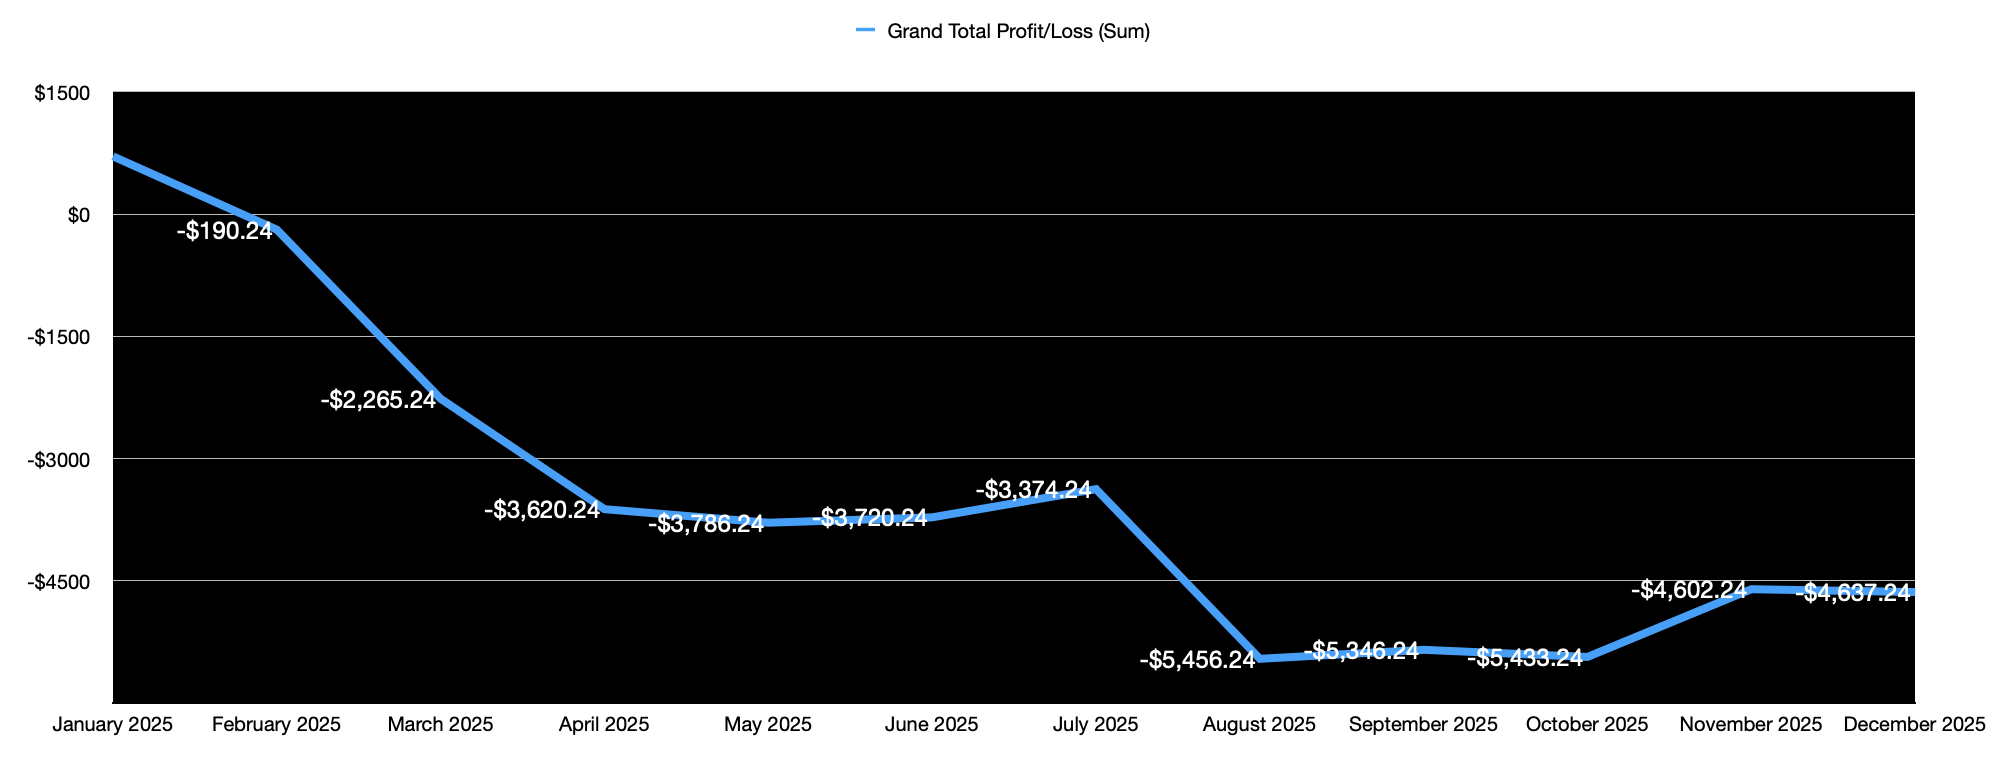
Year-to-date realized P/L: –$4,637.
Here is the Profit/Loss trend for the year.
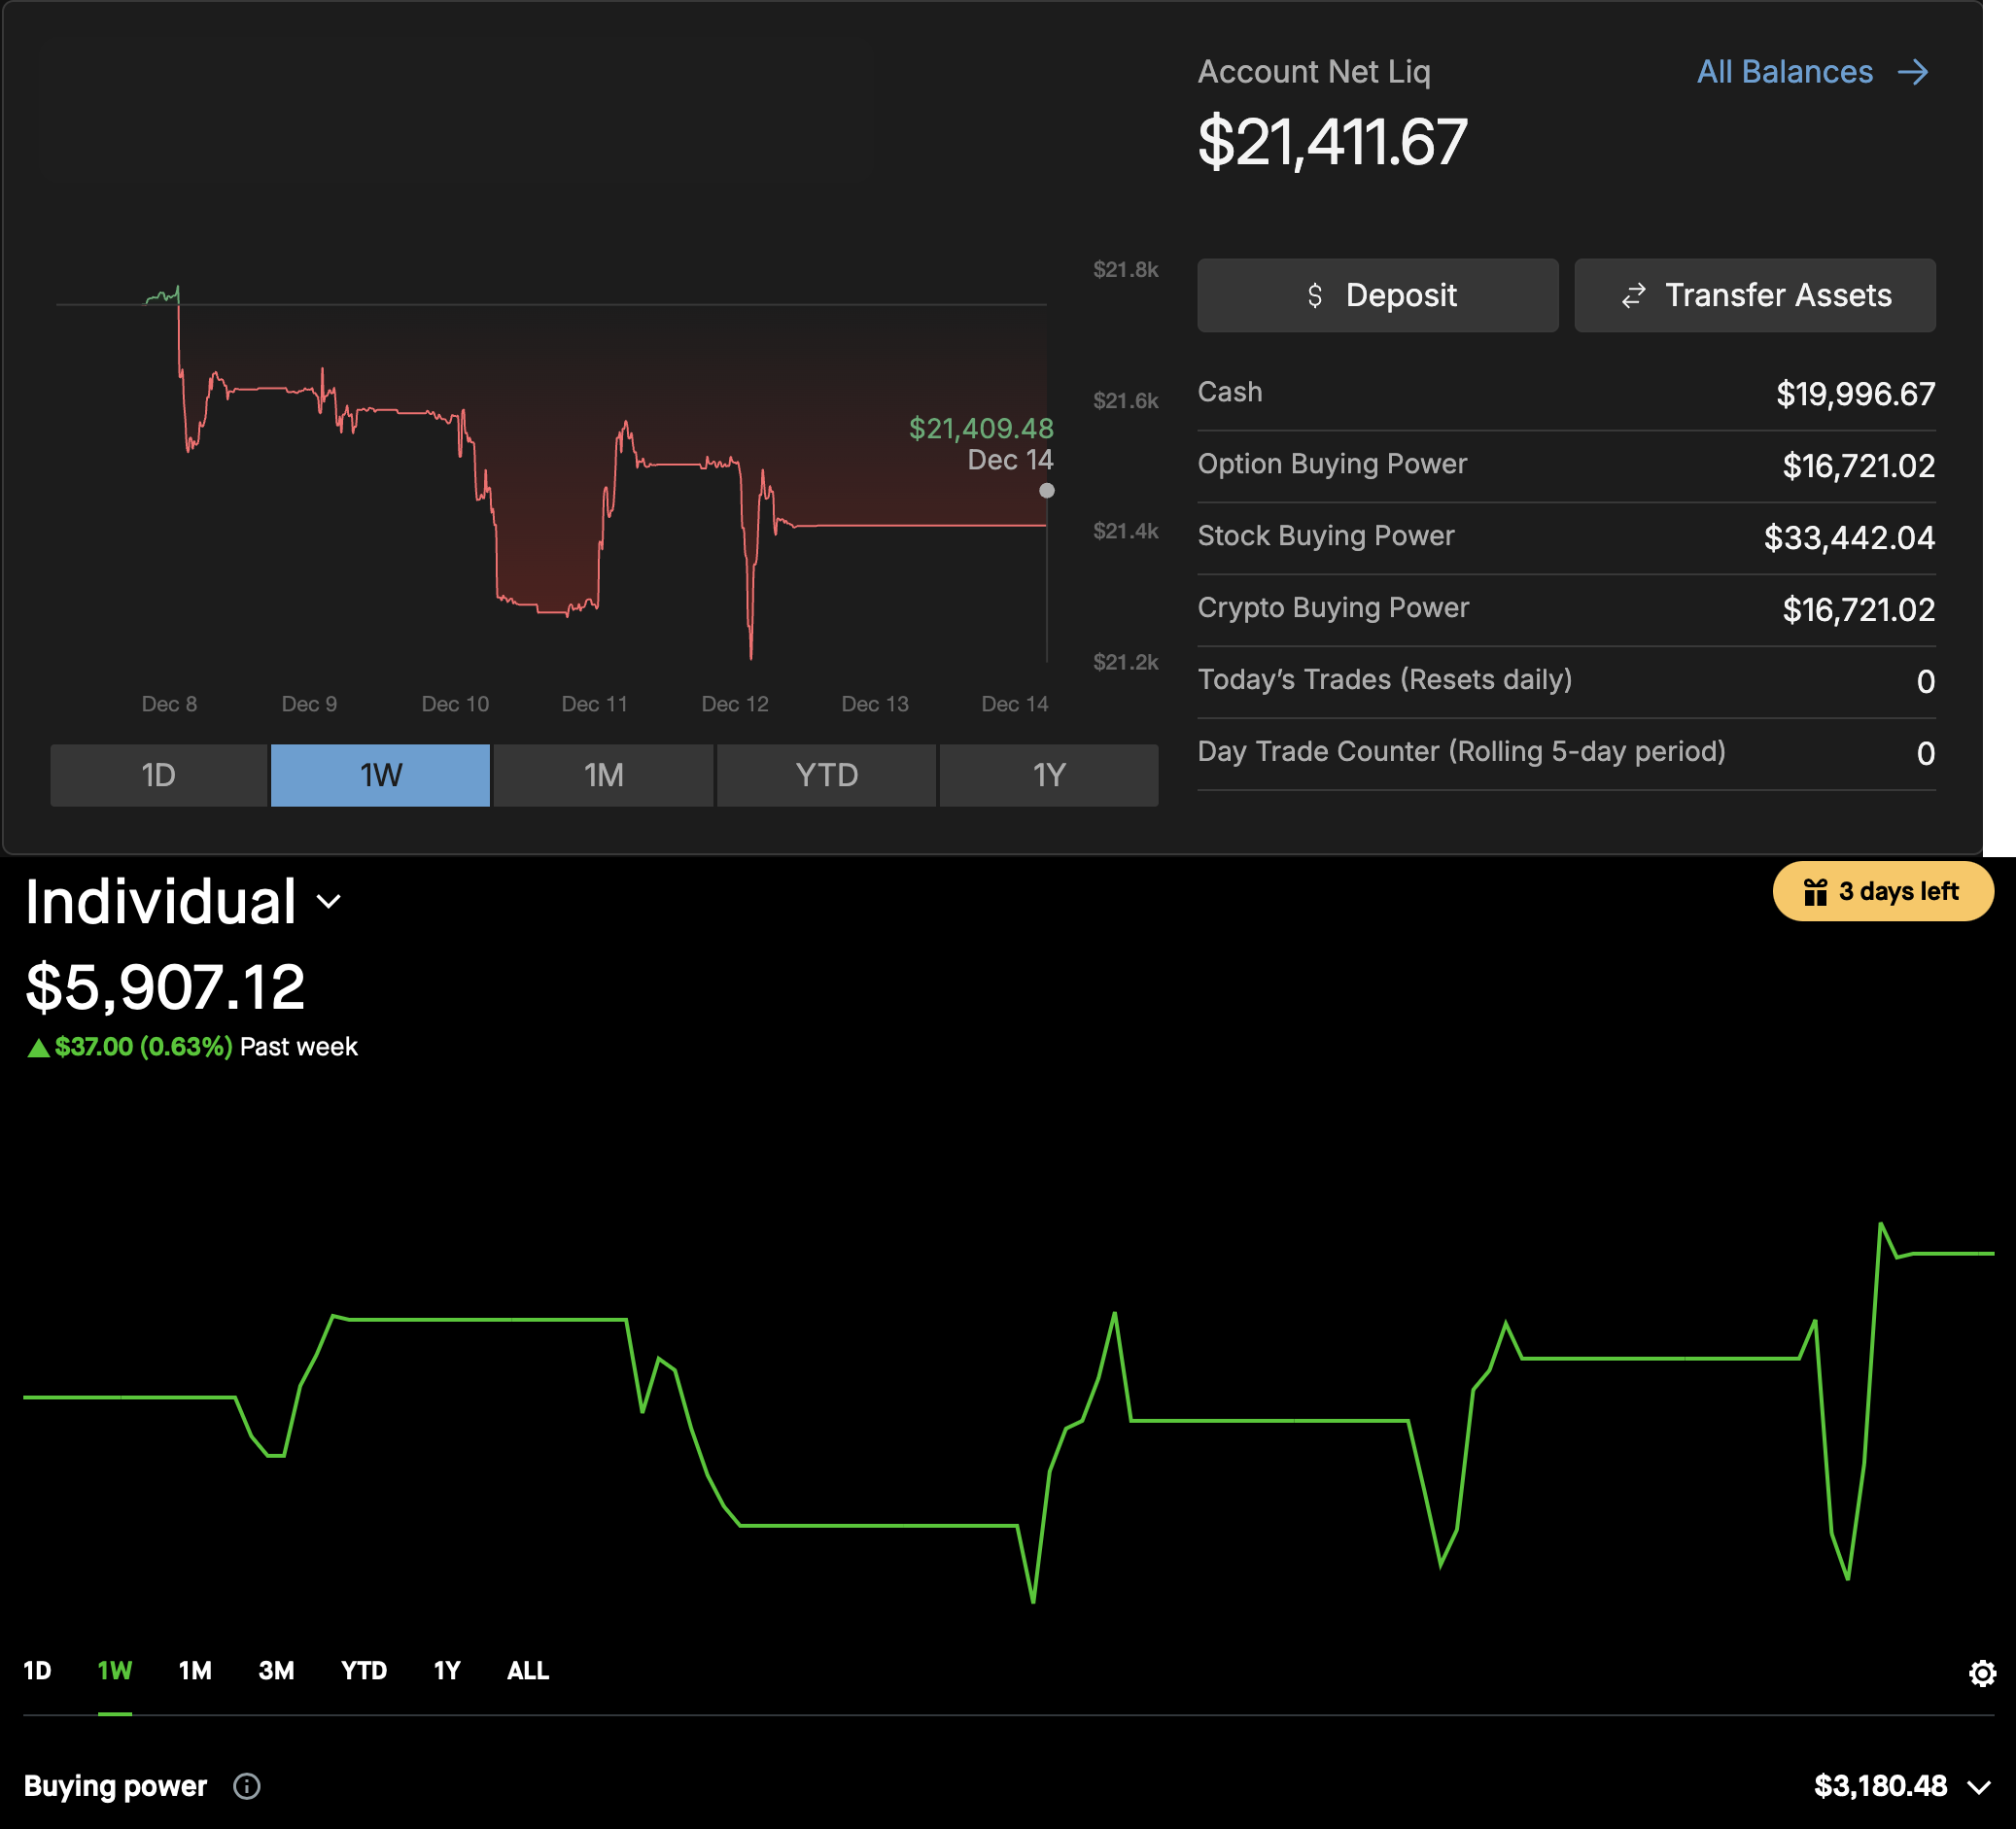
Portfolio
Here is a current snapshot of my TastyTrade and Robinhood portfolios.
Portfolio Strategy Breakdown
Here's a view showing my Win Rate breakdown by strategy deployed.
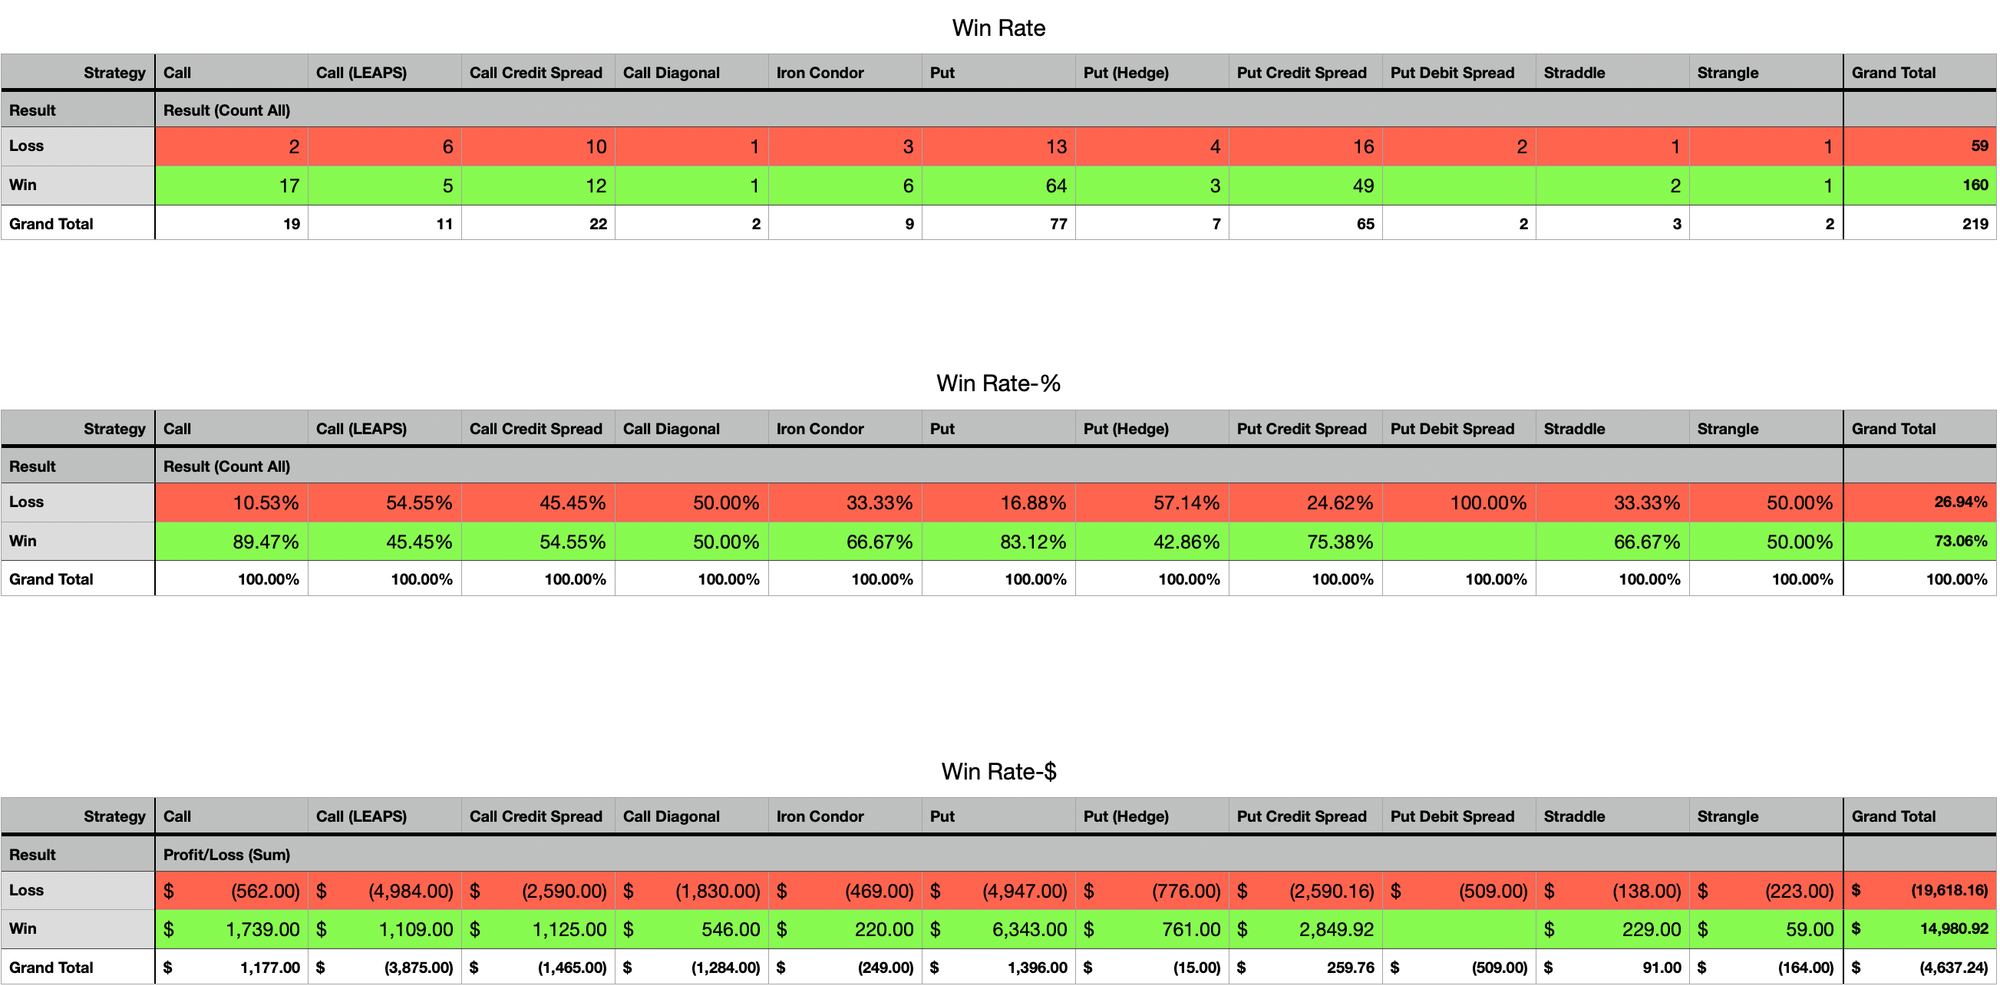
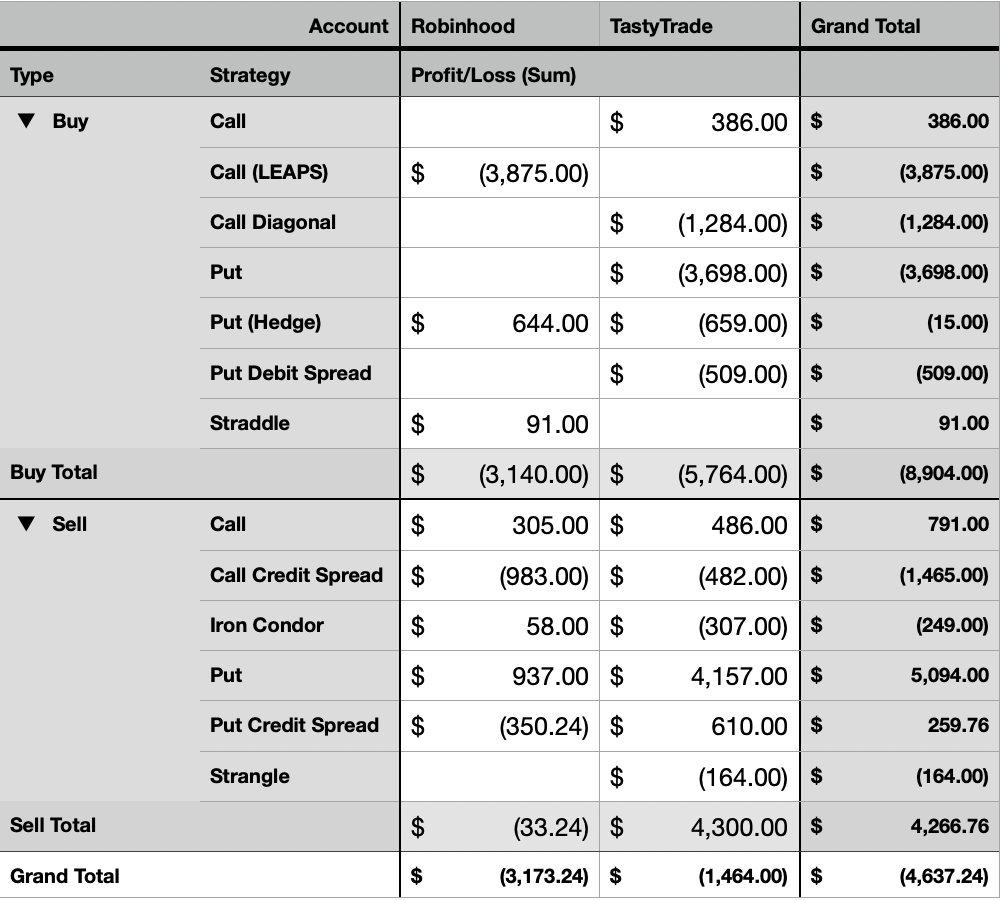
Here is a breakdown of P/L by Buy v/s Sell strategies I have used so far.
Plan for Next Week
I am reading a book called "The Unlucky Investor's Guide to Options Trading" (see GoodReads here). In it, the authors recommend that (I am paraphrasing here):
... in low IV (<20), you should allocate at most 30% of your available capital, and as IV increases (>40), you could allocate up to 50% of your available capital.
and
... at least 75% of your allocated capital should be in undefined risk strategies, with a maximum of 7% allocated per trade, and at most 25% of allocated capital should be in defined risk strategies, with a maximum of 5% allocated per trade.
For a hypothetical $100,000 portfolio, here is how that would look. BPR is Buying Power Reduction.
| VIX Level | Maximum Portfolio Allocation | Minimum Undefined Risk Allocation | Maximum Defined Risk Allocation |
|---|---|---|---|
| 20 | $30,000 | $22,500 ($7,000 max BPR per trade) | $7,500 ($5,000 max BPR per trade) |
| 40 | $40,000 | $37,500 ($7,000 max BPR per trade) | $12,500 ($5,000 max BPR per trade) |
Of course, this is all very subjective and you should do what your risk appetite allows for.
Here is how the allocation currently looks for the Robinhood and TastyTrade portfolio I shared above, where my current available capital is $27,000. I have $19,900 Buying Power available to me, and I am using $7,800 of my BPR. All of my positions are in undefined risk right now. According to above table, ideally I should be allocating 75% of 30% of $27,000 of my BPR to undefined risk, which is $6,000. So I am maybe in a little more risky situation than recommended.
Next week, I will look to either reduce my exposure or move the current positions into higher IV trades. Regardless, I have not found a good way to trade in these low IV conditions yet, so I may look for more earnings style trades, but maybe just for the symbols that are on my watchlist. I have shared this list before, but there may have been some updates, here it is again.
| Symbol | Last | Net Chg | Net Chg % | Bid (Sell) | Ask (Buy) | IV Rank | Volume | Beta | Div Yld | Corr SPY | Liquidity | IV Idx | Name | Exchg |
|---|---|---|---|---|---|---|---|---|---|---|---|---|---|---|
| VIX | 15.74 | 0.00 | 0.00% | -- | -- | 40.3 | -- | -6.00 | 0.00 | ★★★☆ | 97.3% | Cboe Volatility Index | ||
| SOFI | 27.27 | 0.20 | 0.74% | 27.00 | 27.11 | 10.0 | 55.0M | 2.30 | 0.95 | ★★★★ | 58.8% | SoFi Technologies Inc Ordinary Shares | NASDAQ | |
| HIMS | 37.19 | -0.58 | -1.54% | 36.90 | 50.00 | 4.1 | 10.3M | 2.11 | 0.05 | ★★★★ | 70.2% | Hims & Hers Health Inc Ordinary Shares - Class A | NYSE | |
| INTC | 37.82 | -1.69 | -4.28% | 37.75 | 38.35 | 22.4 | 87.8M | 1.38 | 0.34 | ★★★★ | 52.1% | Intel Corp | NASDAQ | |
| CRWV | 78.55 | -8.83 | -10.11% | 70.00 | 84.00 | 15.4 | 35.2M | 2.30 | -0.60 | ★★★☆ | 84.3% | CoreWeave Inc Ordinary Shares - Class A | NASDAQ | |
| UBER | 85.11 | -0.33 | -0.39% | 83.18 | 85.20 | 8.2 | 16.2M | 1.86 | 0.26 | ★★★★ | 33.2% | Uber Technologies Inc | NYSE | |
| NFLX | 95.20 | 1.11 | 1.19% | 92.35 | 98.06 | 27.8 | 49.4M | 2.02 | 0.41 | ★★★★ | 36.9% | Netflix Inc | NASDAQ | |
| TGT | 97.09 | 0.12 | 0.12% | 96.98 | 102.00 | 19.2 | 5.26M | 1.12 | 4.70% | 0.84 | ★★★★ | 32.7% | Target Corp | NYSE |
| HOOD | 119.53 | -3.85 | -3.12% | 119.00 | 130.00 | 16.0 | 31.6M | 2.26 | 0.48 | ★★★★ | 62.7% | Robinhood Markets Inc Class A | NASDAQ | |
| NVDA | 174.99 | -5.94 | -3.28% | 175.00 | 175.20 | 9.2 | 204M | 2.35 | 0.02% | -0.49 | ★★★★ | 41.3% | NVIDIA Corp | NASDAQ |
| PLTR | 183.57 | -3.97 | -2.12% | 178.00 | 185.43 | 2.9 | 42.4M | 1.50 | 0.94 | ★★★★ | 50.5% | Palantir Technologies Inc Ordinary Shares - Class A | NASDAQ | |
| RDDT | 224.47 | -9.07 | -3.88% | 223.21 | 226.00 | 2.2 | 4.93M | 2.12 | -0.24 | ★★☆☆ | 60.8% | Reddit Inc Class A Shares | NYSE | |
| AMZN | 226.19 | -4.09 | -1.78% | 225.97 | 228.02 | 9.6 | 35.6M | 1.38 | -0.36 | ★★★★ | 29.6% | Amazon.com Inc | NASDAQ | |
| MU | 241.08 | -17.38 | -6.72% | 241.40 | 241.42 | 60.0 | 25.9M | 1.52 | 0.18% | -0.91 | ★★★★ | 72.6% | Micron Technology Inc | NASDAQ |
| IWM | 253.91 | -3.89 | -1.51% | 253.66 | 326.83 | 7.3 | 57.7M | 1.09 | 1.05% | 0.97 | ★★★★ | 20.8% | iShares Russell 2000 ETF | ARCX |
| AAPL | 278.37 | 0.34 | 0.12% | 277.25 | 279.78 | 1.0 | 39.5M | 1.08 | 0.37% | 0.27 | ★★★★ | 20.8% | Apple Inc | NASDAQ |
| GOOGL | 309.22 | -3.21 | -1.03% | 308.60 | 308.80 | 9.7 | 36.0M | 1.11 | 0.27% | 0.10 | ★★★★ | 30.2% | Alphabet Inc Class A | NASDAQ |
| TSLA | 459.16 | 12.27 | 2.75% | 456.16 | 456.22 | 7.2 | 96M | 1.75 | 0.23 | ★★★★ | 51.0% | Tesla Inc | NASDAQ | |
| MSFT | 478.35 | -5.12 | -1.06% | 462.66 | 491.66 | 12.0 | 21.2M | 1.06 | 0.75% | 0.40 | ★★★★ | 23.0% | Microsoft Corp | NASDAQ |
| QQQ | 613.57 | -12.01 | -1.92% | 612.80 | 612.82 | 18.7 | 75.2M | 1.18 | 0.44% | 0.73 | ★★★★ | 20.8% | Invesco QQQ Trust Series 1 | NASDAQ |
| META | 644.36 | -8.35 | -1.28% | 642.00 | 643.60 | 2.0 | 14.0M | 1.48 | 0.32% | 0.30 | ★★★★ | 28.2% | Meta Platforms Inc Class A | NASDAQ |
| SPY | 681.74 | -7.43 | -1.08% | 681.75 | 683.00 | 13.2 | 113M | 1.00 | 1.06% | 1.00 | ★★★★ | 15.7% | SPDR S&P 500 ETF Trust | ARCX |
| XSP | 682.74 | 0.00 | 0.00% | -- | -- | 13.3 | -- | 1.00 | 0.00 | ☆☆☆☆ | 15.3% | Mini-SPX | ||
| /ESU5 | 6,657.25 | 22.25 | 0.34% | 6,656.25 | 6,657.75 | 13.2 | 19.8K | 1.00 | ★★★☆ | 15.2% | E-mini S&P 500 Futures, Sep-25 | |||
| SPX | 6,827.41 | 0.00 | 0.00% | 6,786.63 | 6,855.37 | 13.3 | -- | 1.00 | 1.00 | ★★★☆ | 15.4% | S&P 500 Index | ||
| /NQU5 | -- | -- | --% | -- | -- | 18.7 | 0 | 1.18 | ★★☆☆ | 20.5% |
Thanks for following along. See you next week!
📌 Disclaimer: Nothing on this site is financial advice - I’m just here to entertain! Here’s my introduction, my trading philosophy, and some ground rules.